Create a Measure
-
Guide bar Method: the quickest way is to click the Measure
tool located under Home Group in the
Results Ribbon.
Figure 1. 
A guide bar is launched (shown below), which takes you through the following steps.Figure 2. 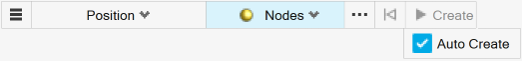
-
Set some options upfront for the measures you would like to create.
Note that the display options are set individually for each measure,
whereas the global options affect all measures.
Figure 3. 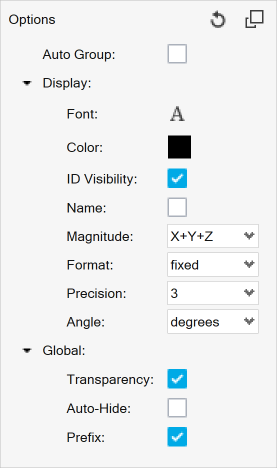
Note: Auto Create is available only for the following measure types: Position, Relative Displacement, Yaw Pitch Roll, Nodal Contour, and Elemental Contour.For other measure types, clicking on the required number of entities in the modeling window or entering the IDs using an input dialog will create the measure item.
-
Set some options upfront for the measures you would like to create.
Note that the display options are set individually for each measure,
whereas the global options affect all measures.
-
Browser Method: Measures can also be created from the Results Browser by
right-clicking and selecting from the context menu.
This will create a Measure group and then the measure items can further be defined using the Entity Editor.
Supported measure types and methods to create these measures:
Option Description Distance Between The distance between two nodes or two systems (markers). - Guide bar Method
- Pick entities graphically or input the IDs. One measure item is created for every pair and assigned its own measure group (default). If the “Auto Group” check box under the Options menu is selected, then all items are put under a single group.
- Browser Method
- Create a measure group first, set the type to Distance Between and then using the Pick Entities field, create and add as many items to the group.
Note: When this measure type is resolved in a cylindrical or spherical user system, the graphical user interface automatically changes to display Magnitude, R, T, Z or Magnitude, R, T, P. The component values are simply calculated as the difference between the component values of the two entities.Minimum Distance The minimum (or shortest) distance between two entities. - Guide bar Method
- Pick From and To entities using the selectors. Once the selections are finalized, click the Create button to create a measure item. One measure item is created for every pair and assigned its own measure group (default). If the “Auto Group” check box under the Options menu is selected, then all items are put under a single group.
- Browser Method
- Click the Entities button to display
the Minimum Distance dialog.Use the From and To input collectors to select, or change, the type of entity that will be added to a measure group. You can then pick entities to be measured directly from the screen, using the quick window selection, or by clicking the Elements, Components, or Nodes input collector and using the extended entity selection menu. See the Select Entities Using the Input Collector topic for more information on selecting entities.Tip: The From collector will always pick nodes (only) on the selected part, and the To collector will either pick nodes or elements on the selected part. For faster computation, it is recommended to use to Nodes for both collectors.
When defining From or To sides, picking entities from more than one model is not allowed. A warning message will be displayed and you will have to redefine the set.
Activate the Save set check box to save the measure groups as a set. See the Sets Panel topic for additional information.
Tip: Check the Notes section below to understand how to Edit or Review a minimum distance measure.Note: When this measure type is resolved in a cylindrical or spherical user system, the graphical user interface automatically changes to display Magnitude, R, T, Z or Magnitude, R, T, P. The component values are simply calculated as the difference between the component values of the two entities.Incremental Distance The incremental distance between two nodes or two systems (markers). The incremental distance gives the relative change in distance between two points. It is calculated by taking the distance between two entities (at the current time step) and subtracting the distance between (at the relevant frame, or time step, depending on the animation mode as defined below). The change of length is displayed. - In transient animation mode, the incremental distance is relative to the time step at which the measure is defined. The change in distance between two points is tracked relative to the time at which the measure is defined.
- In linear or modal animation mode dealing with real data, the incremental distance always gives the change in distance between two points with respect to the undeformed configuration.
- In modal animation mode with complex data, the incremental distance is relative to the frame/angle at which the measure is defined.
- Guide bar Method
- Pick entities graphically or input the IDs. One measure item is created for every pair and assigned its own measure group (default). If the “Auto Group” check box under the Options menu is selected, then all items are put under a single group.
- Browser Method
- Create a measure group first, set the type to Incremental Distance and then using the Pick Entities field, create and add as many items to the group.
Attention: In the case of incremental distance, Magnitude is calculated as the change in magnitude value between the current frame and reference frame and is not calculated from the X, Y, and Z components.Position Available for nodes or systems (only). Provides x, y, and z coordinates at any given time frame. - Guide bar Method
- With Auto Create enabled, pick entities graphically or input
the IDs. One measure item is created for every entity picked
and assigned its own measure group (default). If the “Auto
Group” check box under the Options menu is selected, then
all items are put under a single group.
If you want to first select many entities and then create measures for all of these entities in a single click, then disable Auto Create, pick the desired entities, and click the Create button. This will also put all the created measure items under a single group.
- Browser Method
- Create a measure group first, set the type to Position and then using the Pick Entities field, create and add as many items as possible to the group.
Relative Displacement The distance of a node at any given time relative to a position at the time the measure item is defined. The options, Magnitude, X, Y, and Z, allow you to display the designated value for each selected measure group - Guide bar Method
- With Auto Create enabled, pick entities graphically or input
the IDs. One measure item is created for entity picked and
assigned its own measure group (default). If the “Auto
Group” check box under the Options menu is selected, then
all items are put under a single group.
If you want to first select many entities and then create measures for all of these entities in a single click, then disable Auto Create, pick the desired entities, and click the Create button. This will also put all the created measure items under a single group.
- Browser Method
- Create a measure group first, set the type to Relative Displacement and then using the Pick Entities field, create and add as many items as possible to the group.
Note: When this measure type is resolved in a cylindrical or spherical user system, the graphical user interface automatically changes to display Magnitude, R, T, Z or Magnitude, R, T, P. The component values are simply calculated as the change in component values between the current frame and reference frame.Relative Angle The angle between the new N1 N2 direction versus the original N1 N2 direction defined at the time the measure is created (T1). The display options are True angle, X-projection, Y-projection, and Z-projection. The X-projection option displays the projected true angle onto the plane, with the x-axis as the normal. The Y-projection and Z-projection options act in a similar manner. - Guide bar Method
- Pick entities graphically or input the IDs. One measure item is created for every pair and assigned its own measure group (default). If the “Auto Group” check box under the Options menu is selected, then all items are put under a single group.
- Browser Method
- Create a measure group first, set the type to Relative Angle and then using the Pick Entities field, create and add as many items as possible to the group.
Angle Between The angle between three nodes (N1, N2, and N3) or three systems (markers). Three nodes/markers are required to define the measure. The display options are True angle, X-projection, Y-projection, and Z-projection. - Guide bar Method
- Pick entities graphically or input the IDs. One measure item is created for every three entities picked and assigned its own measure group (default). If the “Auto Group” check box under the Options menu is selected, then all items are put under a single group.
- Browser Method
- Create a measure group first, set the type to Angle Between and then using the Pick Entities field, create and add as many items as possible to the group.
Incremental Angle The incremental angle between three nodes (N1, N2, and N3) or three systems (markers). Three nodes/markers are required to define the measure. The incremental angle gives the relative change in angle formed by the three points. It is calculated by taking the included angle of the three points (at the current time step) and subtracting the angle between (at the relevant frame, or time step, depending on the mode of animation as defined below). The change of angle is displayed. - In transient animation mode, the incremental angle is relative to the time step at which the measure is defined. The change in angle is tracked relative to the time at which the measure is defined.
- In linear or modal animation mode dealing with real data, the incremental angle always gives the change in angle with respect to the undeformed configuration.
- In modal animation mode with complex data, the incremental angle is relative to the frame/angle at which the measure is defined.
The display options are True angle, X-projection, Y-projection, and Z-projection.
- Guide bar Method
- Pick entities graphically or input the IDs. One measure item is created for every pair and assigned its own measure group (default). If the “Auto Group” check box under the Options menu is selected, then all items are put under a single group.
- Browser Method
- Create a measure group first, set the type to Incremental Angle and then using the Pick Entities field, create and add as many items as possible to the group.
Circle radius The radius and center point of a circle defined by three nodes or three systems. The display options are Radius, Ctr X, Ctr Y, and Ctr Z. - Guide bar Method
- Pick entities graphically or input the IDs. One measure item is created for every pair and assigned its own measure group (default). If the “Auto Group” check box under the Options menu is selected, then all items are put under a single group.
- Browser Method
- Create a measure group first, set the type to Circle Radius and then using the Pick Entities field, create and add as many items as possible to the group.
Yaw Pitch Roll The angular rotational displacement of a system (marker) around the z-axis, y-axis, and the x-axis is defined. The display options are Yaw, Pitch, and Roll. - Guide bar Method
- Pick entities graphically or input the IDs. One measure item is created for every pair and assigned its own measure group (default). If the “Auto Group” check box under the Options menu is selected, then all items are put under a single group.
- Browser Method
- Create a measure group first, set the type to Yaw Pitch Roll and then using the Pick Entities field, create and add as many items as possible to the group.
Nodal Contour or Elemental Contour When a contour has been applied to the model, an additional measure option is available. Nodal Contour is added if the contour contains nodal results; Elemental Contour is added if the contour contains elemental results. For each of these measure types, you can display the nodal or elemental values of the selected nodes or elements by activating Value.
- Guide bar Method
- With Auto Create enabled, pick entities graphically or input
the IDs. One measure item is created for every entity picked
and assigned its own measure group (default). If the “Auto
Group” check box under the Options menu is selected, then
all items are put under a single group.
If you want to first select many entities and then create measures for all of these entities in a single click, then disable Auto Create, pick the desired entities, and click the Create button. This will also put all the created measure items under a single group.
- Browser Method
- Create a measure group first, set the type to Nodal/Elemental Contour and then using the Pick Entities field, create and add as many items as possible to the group.
If the contour is based on a MaxLayer/MinLayer/ExtremeLayer, then the Value displayed consists of two parts: a “Value =” display that gives the actual value extracted across all layers that is a Max/Min/Extreme respectively, and a “Layer=” display that provides the layer name corresponding to the Max/Min/Extreme value. This is useful in identifying the significant ply and its value at the same time. Any curves generated from the Create Curves button will be plotting based on the number associated with “Value=”.
An additional Envelope Subcase check box is available if the contour belongs to an Envelope derived load case. This option will only be displayed in the panel if the Envelope function is not of the Range type.
Activating Envelope Subcase will display the subcase to which the value belongs in the case of a subcase trace plot, and the subcase/simulation to which the value belongs in the case of a Simulation or None trace plot.Note: Starting in version 2019, Value will display the underlying numeric value irrespective of whether the Envelope trace plot is set to None, Subcase, or Simulation. Older session files that use Value to display subcase or simulation will be updated to use the Envelope subcase check box instead when loaded in version 2019.Tip: See the Contour Measure Curves topic for a quick way to create curves from this measure.Node Path Two or more nodes are required to define this measure. The nodes located in the path between the selected nodes will be automatically selected. You can continue to select nodes in the model to define a path from which you would like to extract the contour results in order to create a plot. The options, Value and Distance, allow you to display the value and distance magnitude for nodes. Distance displays the distance from the first node to each node along the path. Nodes on a cross-section can be selected for defining a path along the cross-sections. This is useful in measuring the variation of a result, for example the blank thickness in stamping simulation, along a section cut. There are however, certain restrictions on selection and interchangeability of paths on regular model nodes to section cut nodes.
- Guide bar Method
- Pick entities graphically or input the IDs. One measure item is created for every pair and assigned its own measure group (default). If the “Auto Group” check box under the Options menu is selected, then all items are put under a single group.
- Browser Method
- Create a measure group first, set the type to Node Path and then using the Pick Entities field, create and add as many items to the group.
- Note:
-
- Nodes or elements can be selected across different overlaid models.
- Multi-selection of the nodes only works on the nodes of the model (the nodes on cross-sections are not supported).
- Resolving Measures in a Tracking System:
-
If a tracking system has been defined and activated in the Tracking panel, activate the Use tracking system check box to display the measure values relative to the tracking system.
-
Or if the Align with global (T=0) option is activated from the Tracking panel, the tracking system is aligned with global coordinate systems and the displayed measure values are transformed back to global directions. This applies to measures like Position, Relative Displacement, and Distance Between.
Attention: Use tracking is available for all the measure types except Elemental/Nodal Contour and Nodal Path.Restriction: This option is not available if you are using the Modal or Interpolation (formerly Linear Static) animation mode.
-
- Resolving Measures in a User System:
-
Select a user coordinate system for the Resolved in field in the browser Entity Editor, if you would like to reference a system other than the Global System.
Attention: This option is turned off when the Use Tracking check box is activated.
-
- Display of Measure Items within a Group:
-
All of the items/entities included in a measure group are displayed under the Measure group in the Results Browser. Simply expand the Measure Group folder to view the items. Right-click on an item in the browser tree to access the delete option. In the case of a minimum distance measure item, an edit option is also available in the context menu.
Figure 4. 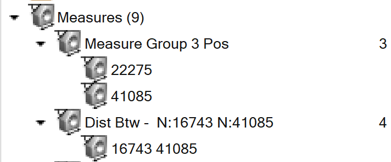
-
Measure items in a group are also listed in the Items field in the Entity Editor. Move a selected item to a different location within the list (up/down) using the reorder arrow buttons
 located to the right of the list box. Delete an
entity from the Measure item list by selecting an
item from the list and clicking the
Delete button.
located to the right of the list box. Delete an
entity from the Measure item list by selecting an
item from the list and clicking the
Delete button. -
If a Live link is available for the items plotted on a single curve, the curve is instantly adjusted to the new order of the items. Reordering also helps in sorting items according to a particular direction of the model (increasing the X, Y, or Z location, or the IDs of the entities).
-
- Review of Minimum Distance Entities:
-
In idle mode, set the entity type to Measures and then either pick the measure item graphically or via the browser. This will highlight the item in the modeling window. Next, right-click in the modeling window and click Review.
-
Alternatively, click the Measure group in the browser, then access the items list by clicking on the Items field in the Entity Editor. Next, click the Review mode button
 in the
dialog to start/enter the review mode.Note: The button will remain in a depressed state to indicate that the review mode is active.
in the
dialog to start/enter the review mode.Note: The button will remain in a depressed state to indicate that the review mode is active. -
The Review mode allows you to see which items/entities are included in the To and From sides of the selected Minimum Distance measure group.
-
When the mode is active, you can click on an item/entity in the Measure item list within a particular Measure group to display which entities are included in the To side of the measure item (highlighted in green) and which entities are included in the From side of the measure item (highlighted in white).
-
To stop/exit the review mode and return the model to its normal display state, simply left click on the Review mode icon again.
-
- Edit of Minimum Distance Entities:
-
Select the minimum distance measure item either graphically or from the browser, then right-click to Edit from the context menu. This will relaunch the guide bar with the current selection and you can then edit the selection and re-save the item.
-
Alternatively, click the Measure group in the browser, then access the items list by clicking on the Items field in the Entity Editor. Click the Edit button
 to
display the Minimum Distance dialog and edit the
entities included in the selected measure.
to
display the Minimum Distance dialog and edit the
entities included in the selected measure.
-