Since version 2026, Flux 3D and Flux PEEC are no longer available.
Please use SimLab to create a new 3D project or to import an existing Flux 3D project.
Please use SimLab to create a new PEEC project (not possible to import an existing Flux PEEC project).
/!\ Documentation updates are in progress – some mentions of 3D may still appear.
Arrows: about
Displaying arrows
The (vector) spatial quantities can be displayed on various supports in the form of colored arrows as follows:
- arrows color commensurate with the quantity modulus
- arrows orientation indicates the quantity direction
Types of arrows
3 types of arrows are available:
- arrows (available on different types of supports)
- arrows on a path
- arrows on boundaries
Supports
Supports for post processing are the following:
- spatial group
- 2D grid
- 3D grid (only in 3D)
- cut plane (only in 3D)
Spatial quantity
The spatial quantity depends on the activated physical application*.
The user can also use a formula with spatial quantities.
Physical location
When support to display arrows is of the volume type (volume region), spatial quantity is computed in the inside of the region.
When support to display arrows is a surface support, it is often in interface between physical regions. The user can thus be interested in the computation and display of the spatial quantities on both sides of this interface, i.e. in each physical region in contact with this interface.
The user benefit from different computation and display options, depending on the support (Arrows: options).
Environment
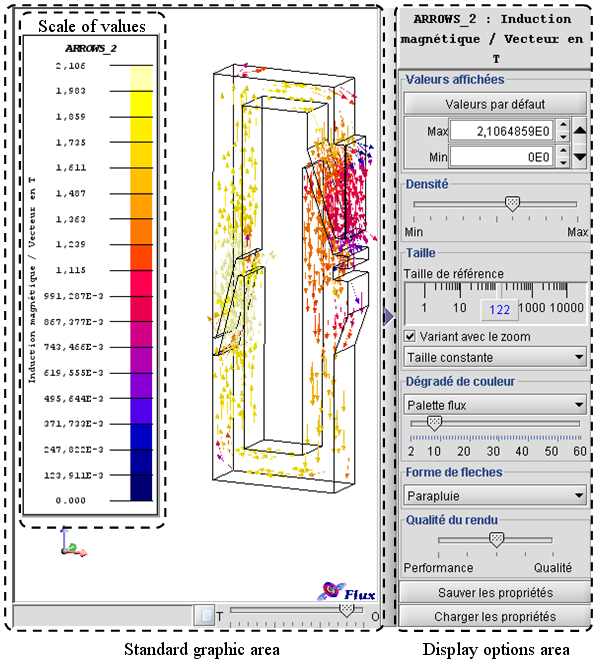
The computed arrows are displayed on the chosen support and visualized in the graphic standard zone with the following item added:
- a scale of values
- a display option zone (arrows: options)
Note: the environment is the same for the display of isovalues, isolines and arrows
| Zone | Function |
|---|---|
| Scale of values |
Area comprising the scale of values calculated and displayed with the correspondence of the color shade. This scale can be displaced in the standard area, enlarged or reduced. |
| Standard graphic area | Area comprising the geometric view of the device with the displaying of the calculated isovalues. |
| Display options area |
Area comprising the display options of the calculations of isovalues, isolines and arrows. Each type of calculation has an activable tab to permit to switch from the display options of the isovalues to the display options of the arrows. |