
Auto Exploration
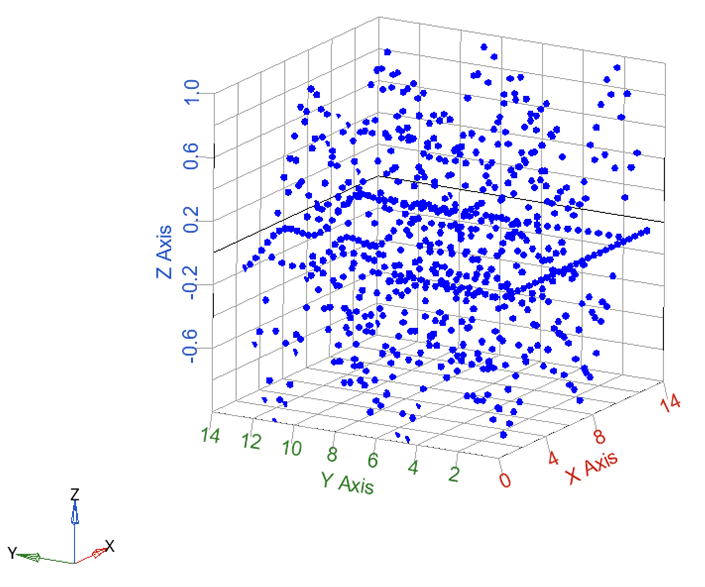
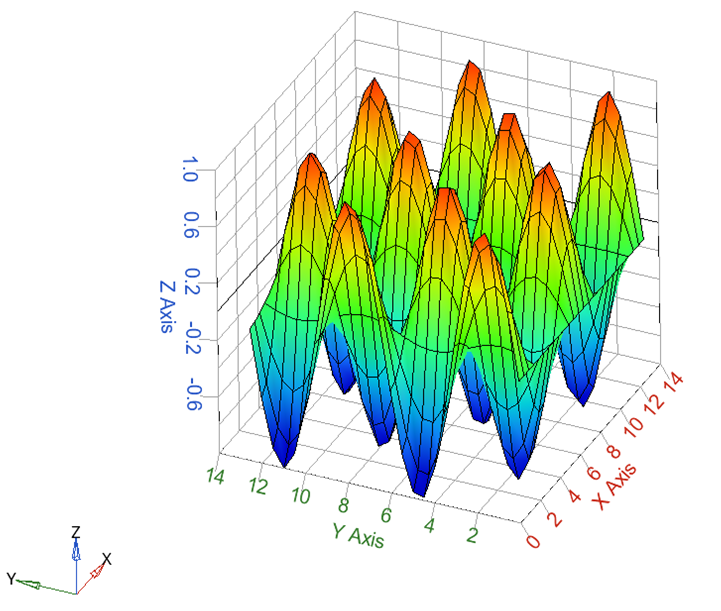
Consider the surface data shown below.
The files used in the example can be found at the following location:
<Twin Activate Installation> \hwx\databases\activate\extensions\romAI\_bin\romAIDirector\demos\romAI\auto_exploration
The auto_explore.oml file can be used to plot the surface data and write it out as .CSV file.
The task is to find the best combination of the number of hidden layers and number of neurons to fit the given surface data. The data is inside the surf_data.csv file and will be used to fit multiple static models in one training. Follow the steps below to run an auto exploration.
- Load the surf.data.csv file in the Builder tab.
- Select ‘x’ and ’y’ as input and ‘z’ as output.
- Select the Auto Exploration option in the Settings tab and
set the auto exploration attributes as shown below:
- Model Type: non linear
- (Hidden) Activation Function: tanh and relu
- Hidden Layers:
- Min: 2
- Max: 3
- Incr: 1
- Neurons X (Hidden) Layer:
- Min: 50
- Max: 150
- Incr: 50
- Epochs: 1000
- Test Split Ratio: 0.1

- Start the training procedure.
After the training is complete, the Post-Processor opens and all the models generated from the training get stored in the auto_1 folder. The best model gets automatically selected in the post-processor. The best performing model is indicated by a value of 1 in the Test Loss Index column.

- Select the Predict on Dataset option in the Hyper Planes
section to see predictions and target data in the same plot.

We can see that the best performing model is surf_demo_relu_100_100_100 out of all the combinations given for exploration. In this way, you can do a grid search on Hyper parameters for best combinations.