Trace Nodes During Animation
- From the Tracing panel, under Trace, select Node.
-
Select the nodes to trace.
- Select nodes By ID using the input collector.
- Pick the nodes directly from the modeling window.
- Activate the Multi-Select option and pick nodes
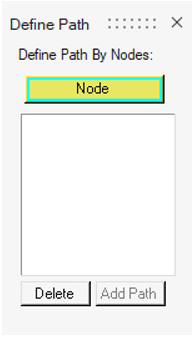
using the extended entity selection dialog.Note: This dialog supports an option to pick nodes by path and add them to the trace list box.
Figure 1. 
The selected node IDs are displayed in the list box. -
Select a Tracing mode option.
Option Description From first step The selected entities are traced starting at the first step to the current step as the model is animated. A line is drawn to illustrate the traced entities. The traced path is erased when the animation starts over. All steps All steps of the selected entities are traced. Last The traced path is restricted to the last user-specified time steps before the current step. This gives the appearance that the path is following the selected entities. The number of time steps specified will be applied to all entities displayed using this option. HyperView accepts time steps 1-99. Select The selected entities are traced for the selected simulation steps. Click on … to select the required steps. - Change the display options if desired.
-
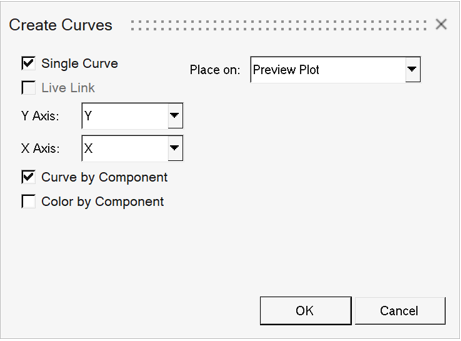
Create Curves from the Tracing panel, similar to
creating curves from measures.
Figure 2. 
Option Description Single Curve Create a single curve out of all the nodes in the trace list box. Selecting this check box will enable the X Axis, Curve by Component, and Color by Component options. Live Link Select the Live Link check box to establish a link between the Trace panel selection and the curve in the HyperGraph window. Activating this option will remove the Curve by Component and Color by Component options. Y Axis, X Axis Select a component of the (position) measure to define the Y and X axis in the plot. Note: A position measure is created behind the scenes to plot a curve from the trace panel.Curve by Component When creating a single curve out of all the nodes, selecting this check box will create one curve per Component. Color by Component When creating a single curve out of all the nodes, selecting this check box will assign the Component color to the corresponding curve. Place on Select a destination window for the curve. -
Animate the model.
Note: Tracing is not displayed unless the time steps have been loaded.Tip: The number of time steps displayed behind the traced entities can be specified in the preferences.mvw file using the *NumStepsToTrace() statement.