


|
Adding a New Data Table using the Workbook Internal Data Table Editor
In the Workbook Data Table Editor, follow the steps below to add data tables.
Steps:
1. On the Data Table pane, click
 .
.
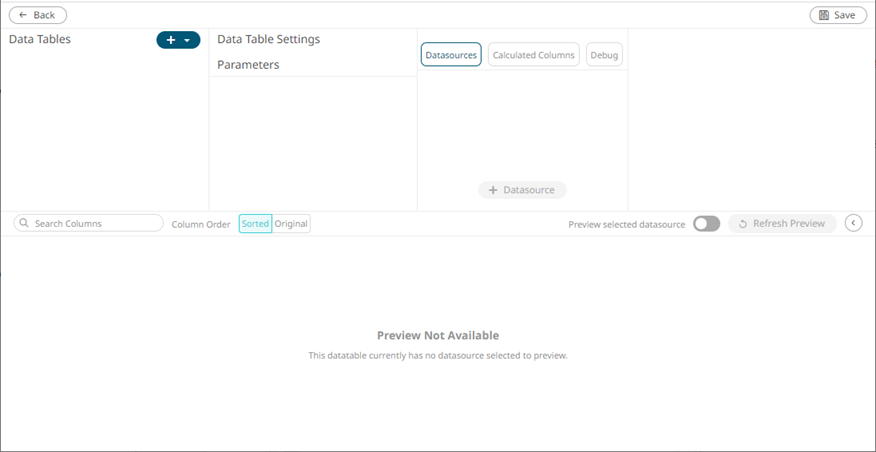
The Workbook Internal Data Table Editor view displays.
2. On
the Data Tables pane, click ![]() and
select New Data Table:
and
select New Data Table:
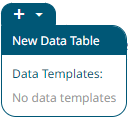
A new data table instance is created.
In the Connector List pane, some connectors require additional third-party software installation to be enabled. This typically requires adding JAR files to the Libfolder of the Tomcat installation and restarting Tomcat. For the supported Elasticsearch connectors, refer to the Elasticsearch Connectors Dependency Installation section. For the other connectors, refer to Panopticon Real Time Installation and Reference Guide for more information.
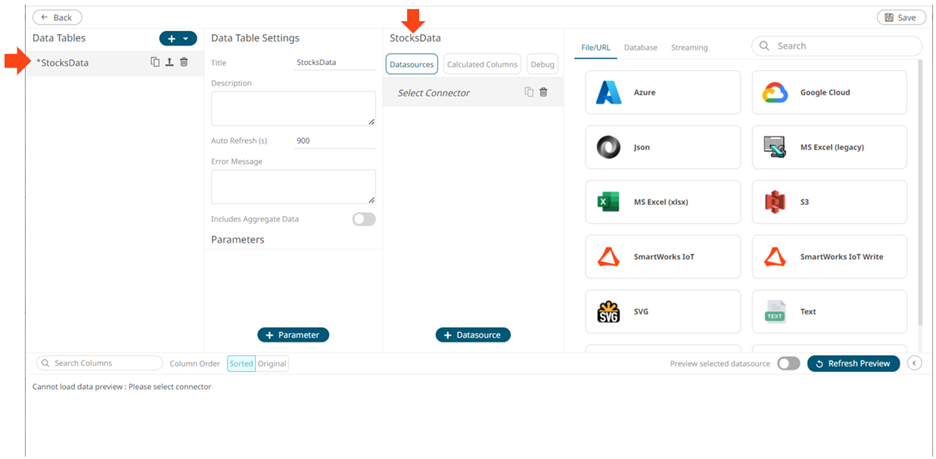
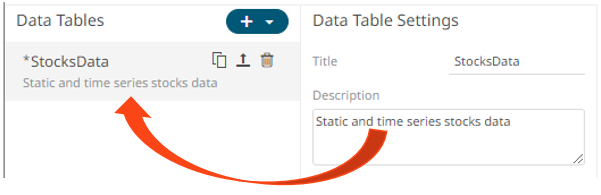
3. On the Data Table Settings pane,
enter the Title of the data table and click  . The new name is applied to the data
table under the Data Tables pane and on the Data Sources
pane.
. The new name is applied to the data
table under the Data Tables pane and on the Data Sources
pane.
4. Enter the Description of the data table.
This is also displayed under the data table instance which can be helpful when selecting among the data tables in the list.
5. You can opt to enter the Auto Refresh period.
This property defines how often the data source is checked for new data, when accessing the source directly. Panopticon will issue new queries at the interval shown in the Auto Refresh (s) box and automatically deliver updates to the workbook. The default is 900 seconds (15 minutes). The minimum refresh period depends on the performance of your data repository and the amount of time required executing your data queries.
If a streaming source is selected, the refresh period is ignored.
|
NOTE |
· Setting the Auto Refresh field to any value less than or equal to zero will disable the auto refresh for the data table. · The Auto Refresh property is a string and can be parameterized. |
6. You can also opt to enter a custom Error Message that will be displayed when an error occurs while fetching data.
|
NOTE |
The Error Message can be parameterized. |
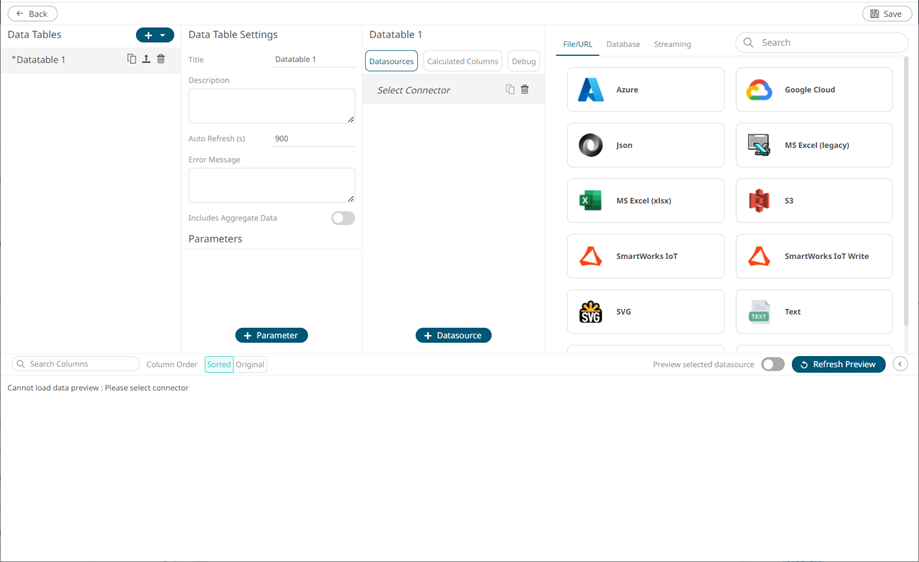
7. To add a data source, click a connector group tab.
· File/URL
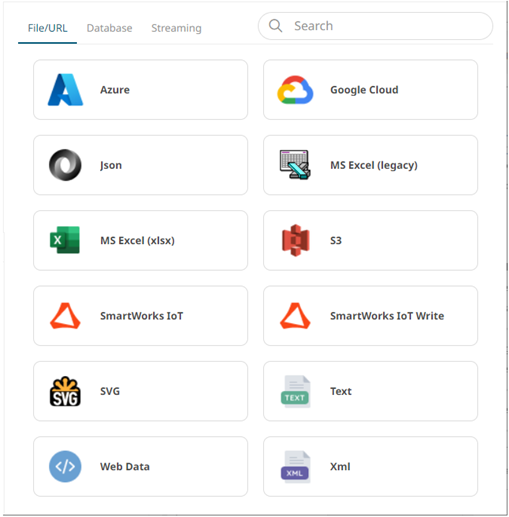
Then select one of these data sources:
|
· Azure |
· JSON |
|
|
· S3 |
||
|
· SVG |
||
|
· Text |
· Web Data |
· XML |
· Database
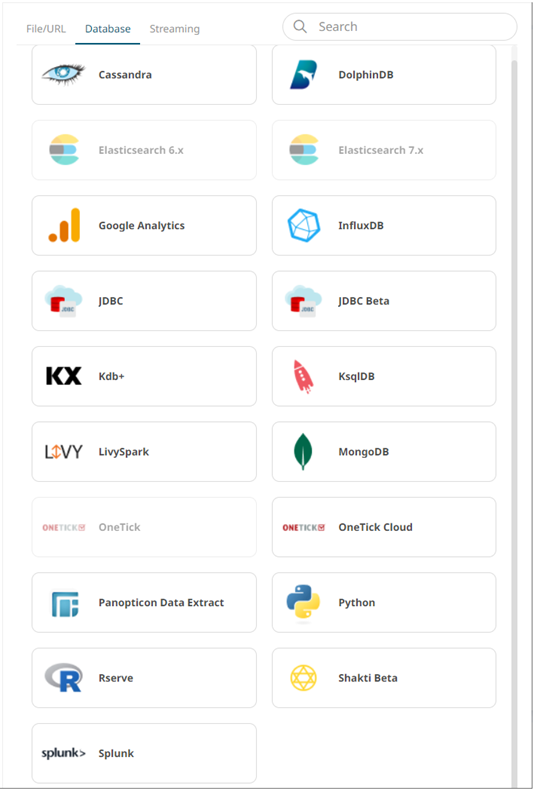
Then select one of these data sources:
|
· InfluxDB |
||
|
· JDBC |
· Kx kdb+ |
|
|
· KsqlDB |
· MongoDB |
|
|
· OneTick |
||
|
· Python |
· Rserve |
|
|
· Splunk |
|
|
· Streaming
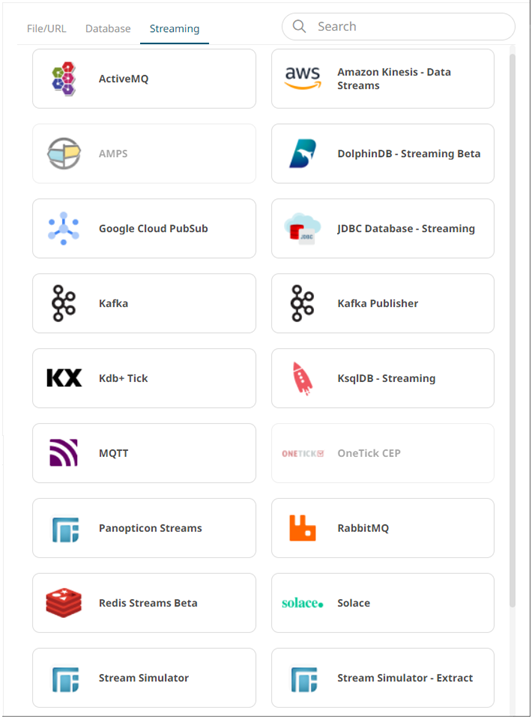
Then select one of these data sources:
|
· ActiveMQ |
· AMPS |
|
|
· Kafka |
||
|
· MQTT |
||
|
· RabbitMQ |
||
|
· Solace |
||
8. Tap the Preview Selected Data Source slider to turn it on and display the preview of the selected data source.
9. Then, you can either click:
·  for static connectors
·  for streaming connectors
The retrieved query/table/sheet/schema is displayed in the Data Sources pane. The system displays the preview data at the bottom of the screen.
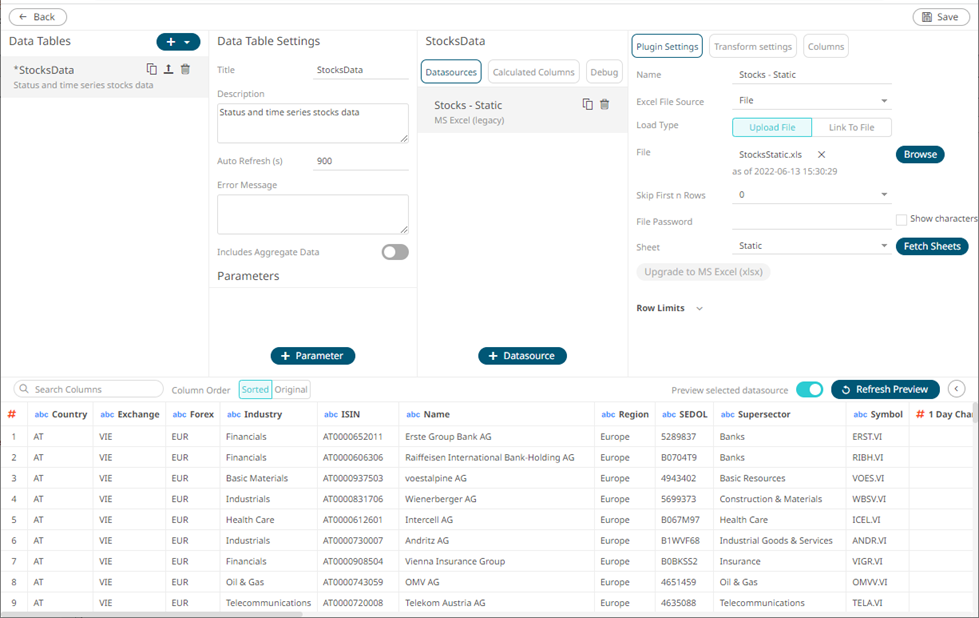
Click
 to collapse the Data Preview
pane.
to collapse the Data Preview
pane.
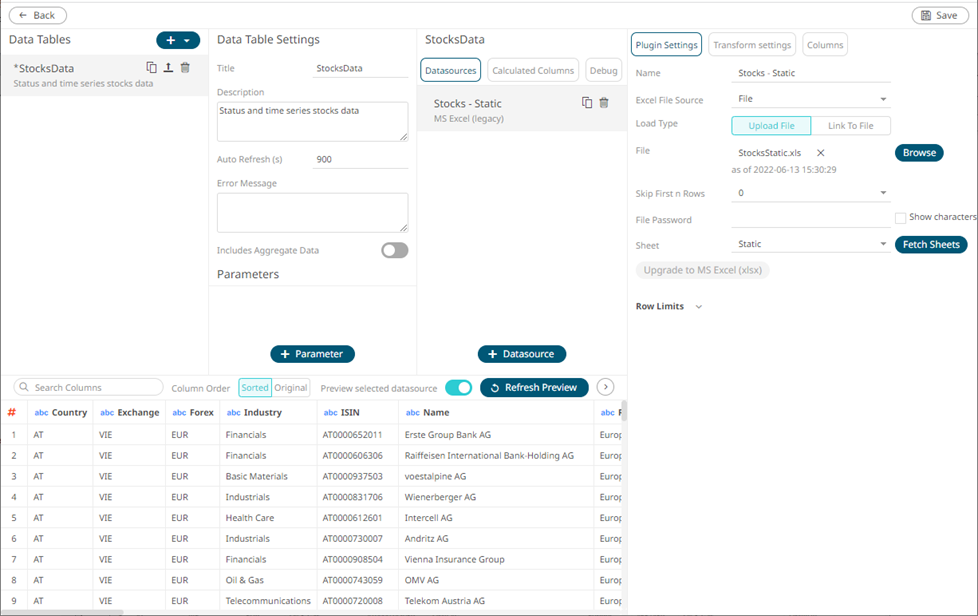
Click
 to expand the Data Preview
pane.
to expand the Data Preview
pane.
10. After adding data sources, you can also:
· Manage data source properties
· Define transform settings
· Retrieve external aggregates
· Sort columns
· Define a join or union all of the data sources
· Add user defined columns such as:
¨ Auto key
¨ Numeric bucketing (Identity, Sign, Manual, Equal Density, and Equal Distance)
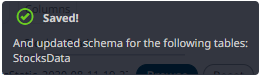
11. Click the Save  button.
When saved, the notification displays:
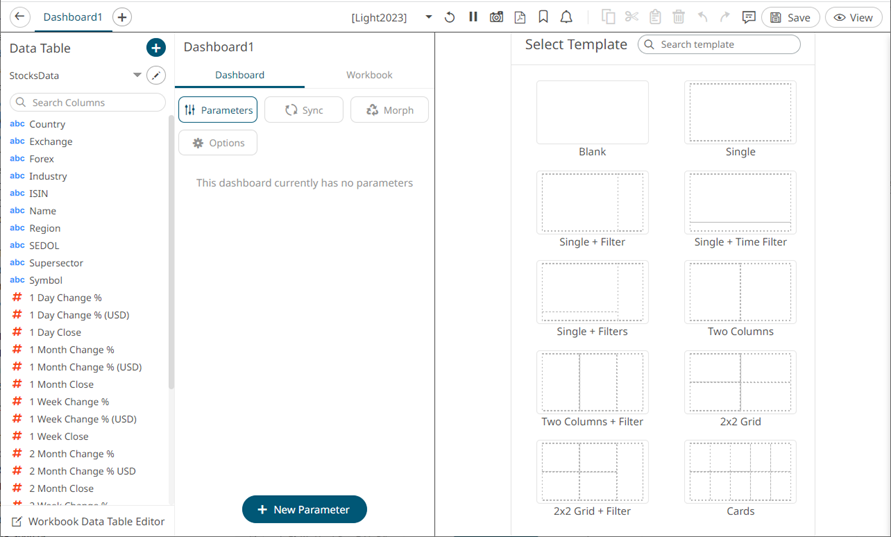
12. Click  . You are returned to the Open
Workbook in Design Mode, with the new data table added in
the Data Table pane drop-down list.
. You are returned to the Open
Workbook in Design Mode, with the new data table added in
the Data Table pane drop-down list.
|
IMPORTANT |
The succeeding sections in this chapter mostly apply to the Workbook Internal Data Table Editor layout. |