Indoor Communication, 802.11g with IRT
The network planning of a local area network in an indoor scenario is investigated. The model is a multi-story building. The intelligent ray tracing model (IRT) method is used.
Sites and Antennas
There are five antenna sites at different locations in the building for best coverage. The omnidirectional antennas are installed at a height of 2.5 m. Three different carrier frequencies around 2.4 GHz are used.
Air Interface
Computation Method
Results
Propagation results show, at every location, the power received from each transmitting antenna individually.
The type of network simulation used is a static simulation (homogeneous traffic per cell). The network simulation calculates results like cell area, site area, best server, maximum data rate. From network results, a single data rate of 11 Mbit/s can be seen over the total area available.
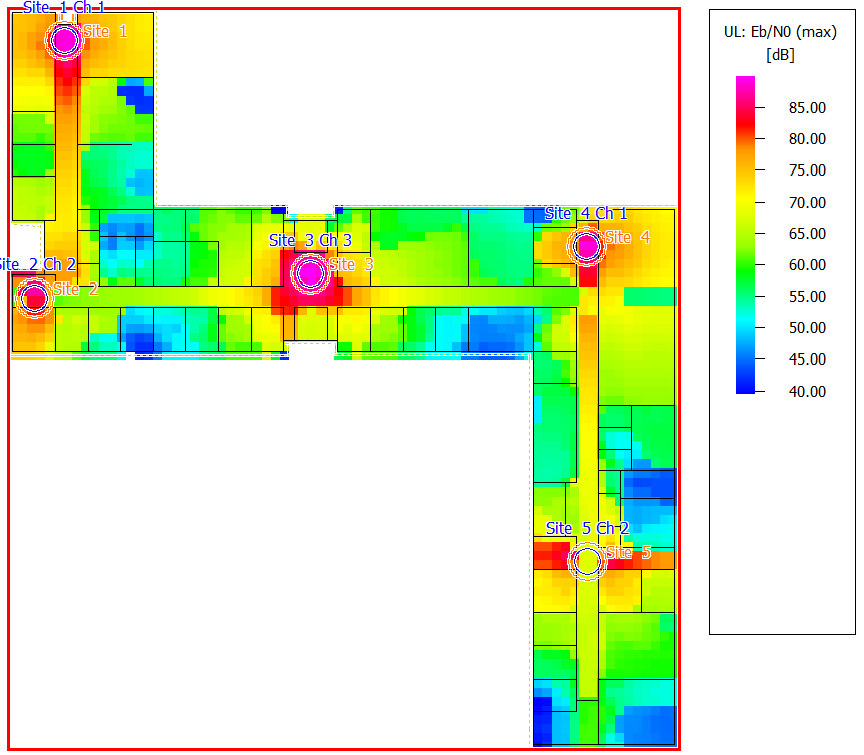
The network simulation calculates the minimum required transmitter power, maximum achievable received signal strength, maximum achievable Eb/N0 and maximum achievable Ec/(N0+I0) for all modulation and coding schemes used in this model for both downlink and uplink.