TETRA Coverage with Monte Carlo Analysis
Perform traffic simulation and export a report using Monte Carlo analysis for trans-European trunked radio (TETRA).
TETRA
TETRA is a European radio standard for professional mobile radio and two-way transceiver. The primary purpose of this type of system is efficiency. A large number of people can carry many conversations over only a few distinct frequencies. Used by government agencies, emergency services, rail transport staff, transport services, and military to provide two-way communication. Both point-to-point and point-to-multipoint transfer can be used.
Motivation for a Monte Carlo Analysis
In this example, a traffic simulation report is generated using the Monte Carlo approach. A Monte Carlo analysis helps to evaluate the numbers of served, blocked, and not-assigned mobiles (users) for each application and each cell. For radio network planning, different types of simulations are available. Monte Carlo simulations use randomly distributed users, which are generated according to location-dependent traffic definitions.
Model Type
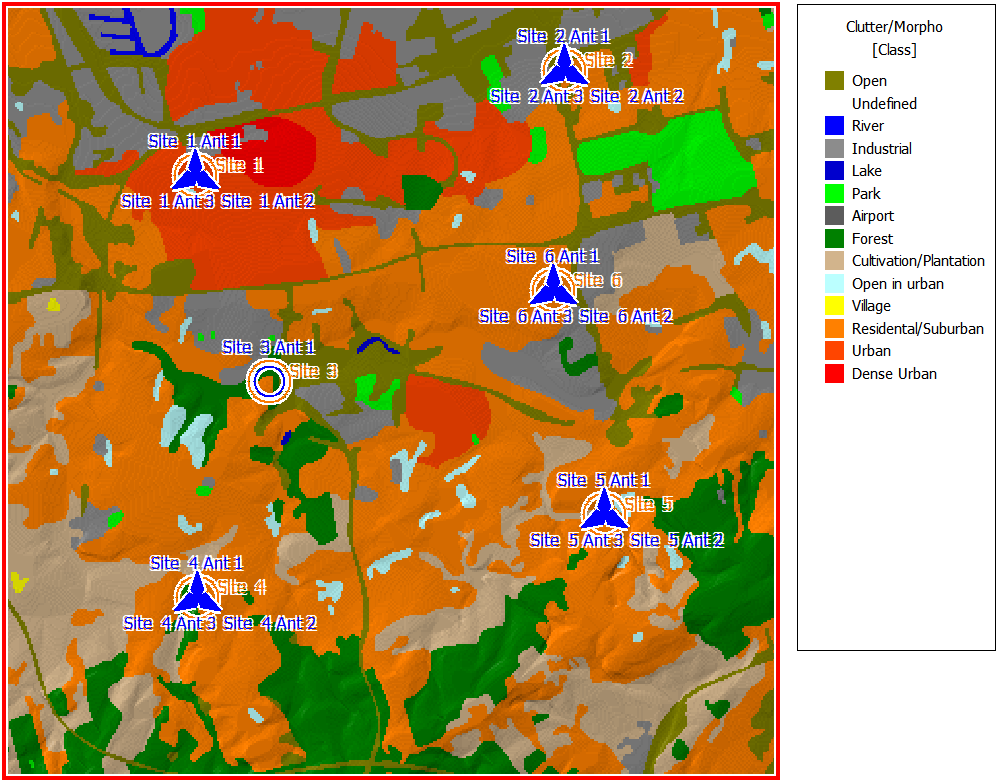
Sites and Antennas
Air Interface
The air interface is defined by a TETRA wireless standard (.wst) file. TETRA uses TDMA with four user channels on one radio carrier and 25 kHz spacing between carriers. Frequency division duplex (FDD) separation between uplink and downlink is set to 10 MHz.
A list of different modulation and coding schemes are added to this interface. Click Transmission Modes on the Air Interface tab.
Computational Method
The dominant path model (DPM) computation method is selected. This method focuses on the most relevant path in 3D, which can be more accurate than an empirical method or a 2D method.
Results
Propagation results show at every location the power received from each transmitting antenna. Results are calculated for a single prediction plane at 1.5 m height.
- cell area
- site area
- maximum data rate
- maximum throughput for both uplink and downlink
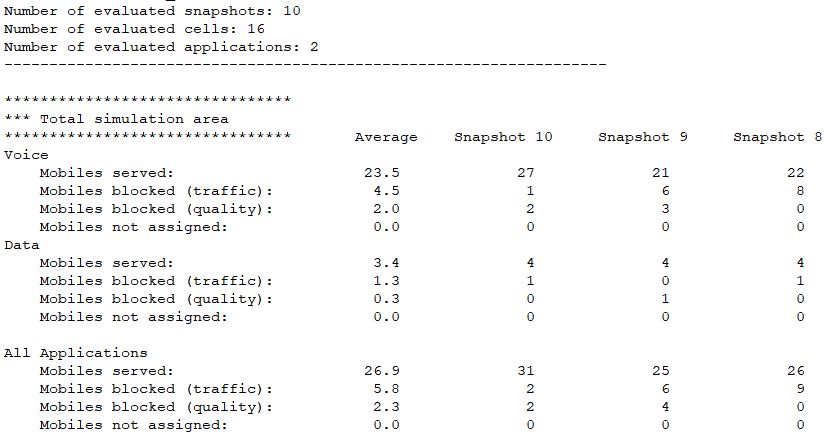
Network results also include the Monte Carlo report arranged in tabular format (10 snaps and their average) evaluated for 16 cells. It also includes a histogram for cell load, noise rise, and throughput for downlink and uplink. As an example, a snippet of the Monte Carlo report is shown in Figure 2.