Indoor Communication, 3G
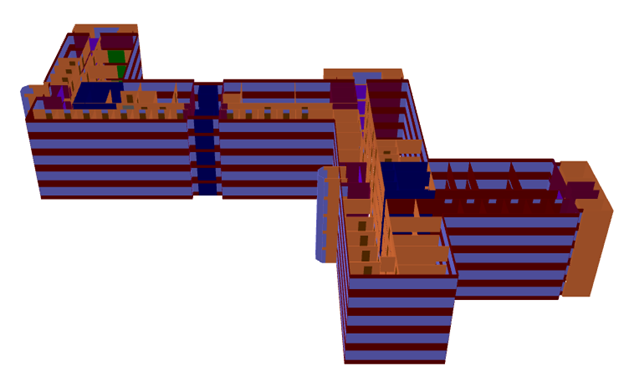
The network planning of an indoor scenario is investigated. The model consists of a large multi-story building.

Sites and Antennas
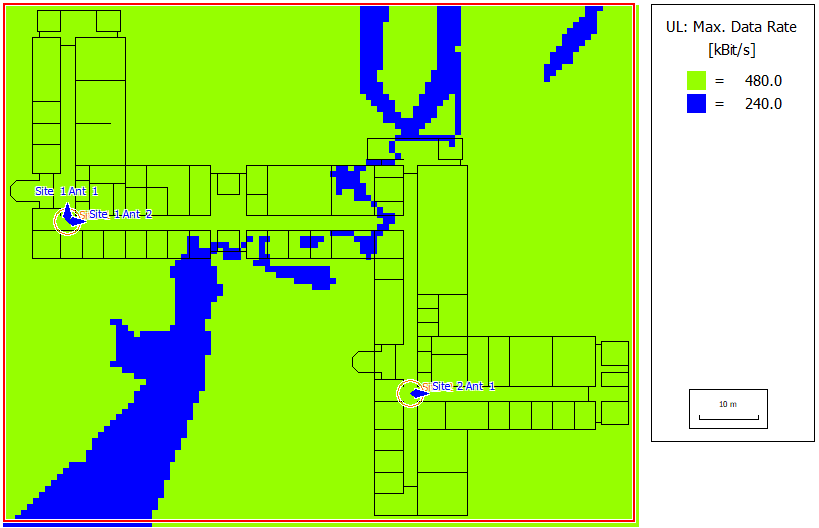
Three antennas are placed at two different sites on the ground floor for the best indoor coverage of the floor. The antennas use the same carrier (same frequency) and are installed at a height of 3.5 m, just below the ceiling.
Air Interface
The air interface is defined by a (3G) UMTS wireless standard (.wst) file. CDMA/WCDMA/HSPA (Code Division Multiple Access) is selected for multiple access. A list of different modulation and coding schemes are added to this interface under Transmission Modes on the Air Interface Tab.
Computational Method
Results
Propagation results show, at every location, the power received (by a hypothetical isotropic receiver) from each transmitting antenna individually.
The type of network simulation is a static simulation (homogeneous traffic per cell). The network simulation calculates the minimum required transmitter power, maximum achievable received signal strength, reception probability (including fast fading), maximum achievable Eb (energy per bit), maximum achievable Ec/(N0+I0) and maximum number of parallel streams at the given location for all modulation and coding schemes used in this model, for both downlink and uplink.
Since the same carrier (same frequency) is used for all antennas, they tend to interfere with each other. This is visible in the results - the maximum data rates in locations between these two antenna sites are notably lower.
