The network planning of an urban scenario with 2.5 G is investigated.
Sites and Antennas
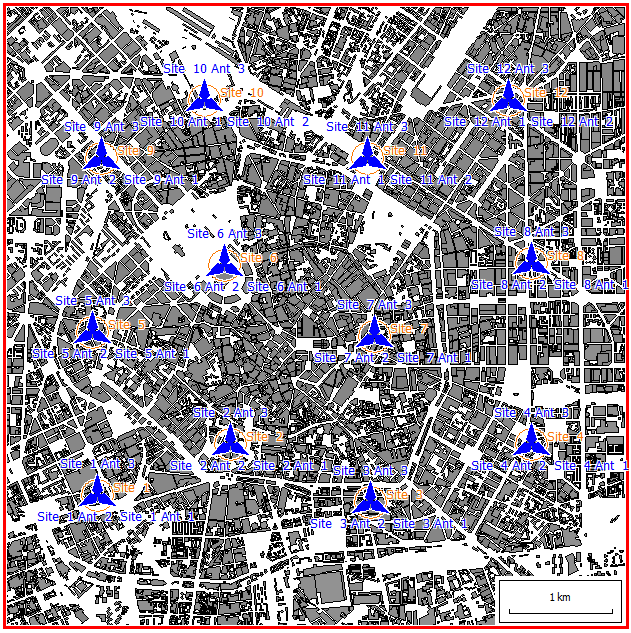
There are twelve antenna sites with three antennas each. The transmission sites are
placed at different places and at different heights to get good data rates in almost
the entire area under consideration. Each site has three sector antennas each, at
120° relative rotation, for complete 360° coverage.Figure 1. Urban area topography and transmitter sites.
The small cell configuration used in this model is of the micro-cell type. Hence the
height of each antenna is almost the same as the height of the building.
Air Interface
The air interface is defined by a GSM wireless standard (.wst)
file. Time-division multiple access (TDMA) is selected for multiple access. The
number of time slots on a carrier is 8.
Tip: Click Project > Edit Project Parameter and click the Air Interface tab to view
the carriers and transmission modes.
Computational Method
For an urban environment such as this one, the dominant path model (DPM) is well-suited. DPM focuses on the most relevant path, which
leads to shorter computation times compared to ray tracing. Regarding ray tracing,
in an urban scenario, this requires a preprocessed geometry database. Since this
project is not based on a preprocessed database, intelligent ray tracing model (IRT) is not available.
Tip: Click Project > Edit Project Parameter and click the Computation tab to change
the model.
Results
Propagation results show at every location the power received from each transmitting
antenna.
The type of network simulation is a static simulation (homogenous traffic per cell).
The network simulation calculated minimum transmission power, SNIR (max), and
reception probability (including fast fading) for both downlink and uplink.
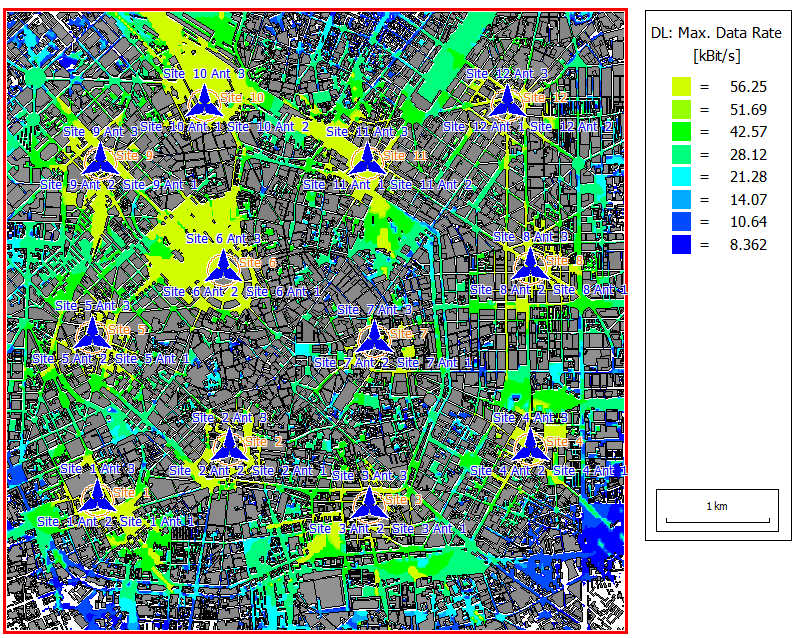
The signal propagation is strongly affected by the reflections and diffractions from
buildings. These effects can be observed when results for the maximum data rate are
viewed in the model.Figure 2. Download data rates for the urban network planning.