Urban LTE with Monte Carlo
Perform urban network planning with LTE and generate a Monte Carlo report.
Motivation for a Monte Carlo Analysis
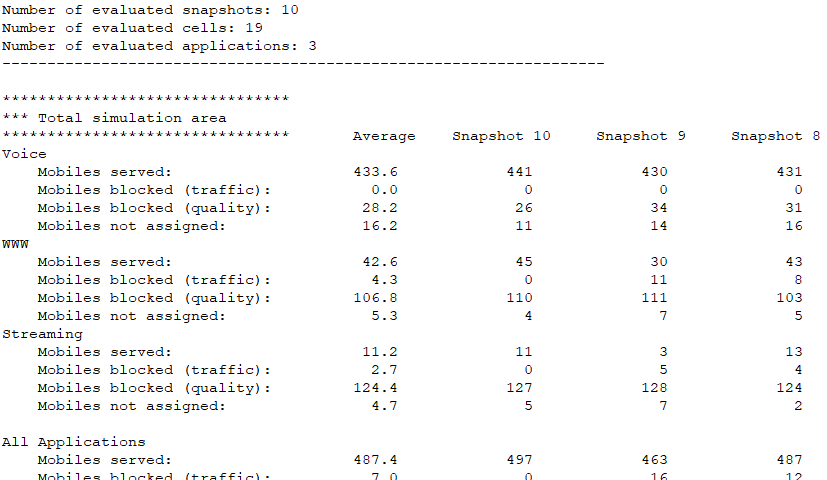
A Monte Carlo analysis helps to evaluate the numbers of served, blocked, and not-assigned mobiles (users) for each application and for each cell. In this example, a traffic simulation report is generated using the Monte Carlo approach. For radio network planning, different types of simulations are available. Monte Carlo simulations use randomly distributed users, which are generated according to location-dependent traffic definitions.
Model Type
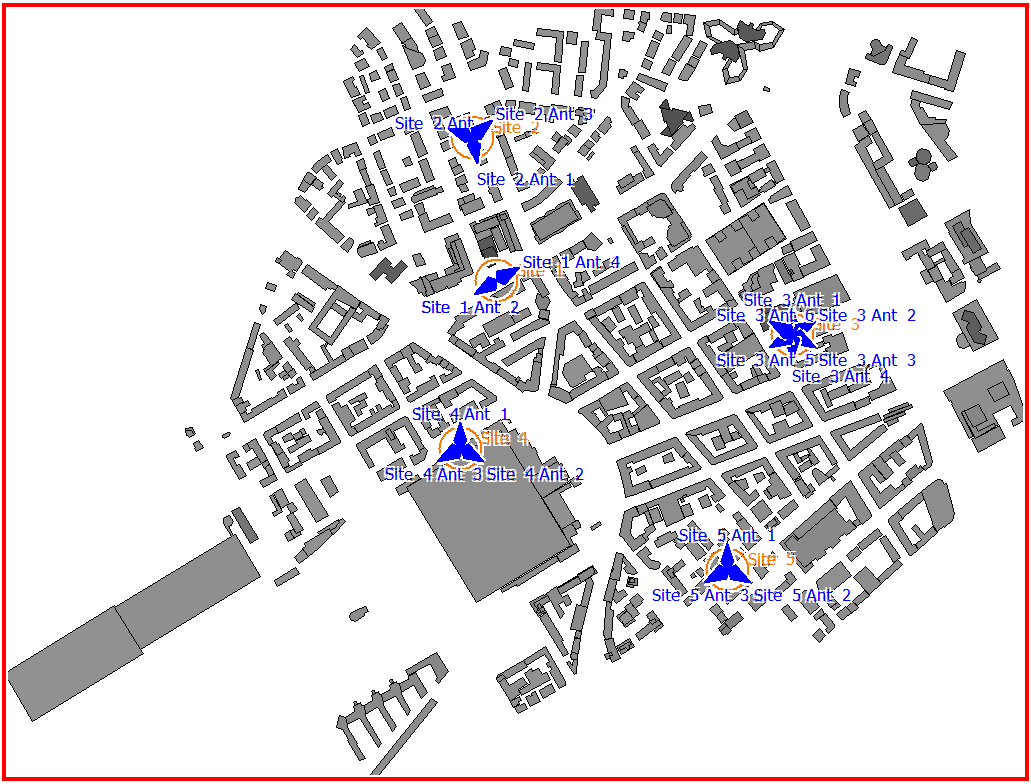
Sites and Antennas
Air Interface
The air interface is defined by a long term evolution (LTE) wireless standard file, LTE_Band1_BW_20MHz_FDD.wst. Orthogonal frequency division multiple access (OFDM/SOFDMA) is selected for multiple access. Two-stream MIMO technology is in use at Site 1.
Computational Method
The dominant path model (DPM) focuses on the most relevant path, which leads to shorter computation times compared to rigorous ray tracing. Empirical losses are used for transmission, reflection, and diffraction. Empirical losses can be determined with measurements, whereas obtaining actual electrical material properties can be more difficult.Results
The type of network simulation is a Monte Carlo simulation (location dependent traffic). Propagation results show at every location the power received from each transmitting antenna. Results are calculated for a single prediction plane at a height of 1.5 m.
For all modulation and coding schemes, the network simulation calculates the following:
- signal area
- cell area
- site area
- maximum data rate
- maximum throughput
- number of MIMO streams for both uplink and downlink
Network results also include the Monte Carlo report arranged in tabular format (10 snapshots and their average) evaluated for 19 cells, and histograms for cell load, noise rise, and throughput for downlink and uplink. As an example, a snippet of the Mote Carlo report is shown in Figure 2.