Indoor LTE with Monte Carlo
Perform indoor network planning with LTE and generate a Monte Carlo report.
Model Type
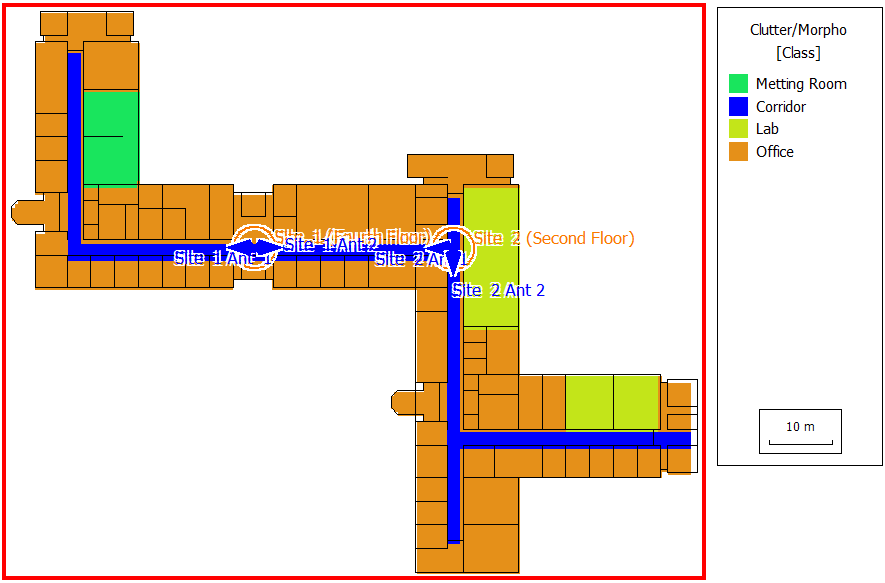
Sites and Antennas
One antenna site is located on the second floor, and the other is on the fourth floor. Each site has two directional antennas. All the antennas use different carrier frequencies to minimize interference. The frequencies are set to 2115 MHz, 2125 MHz, 2135 MHz, and 2145 MHz.
Air Interface
The air interface is defined by an LTE wireless standard in the file, LTE_Sample_Indoor_MonteCarlo.wst. Orthogonal frequency division multiple access (OFDM/SOFDMA) is the multiple access scheme selected for this air interface. The duplex separation between uplink and downlink is done using frequency division duplex (FDD) and is set to 190 MHz.
Computational Method
As the model is a large office building, a computation method suitable for large structures is required. The dominant path model (DPM) focuses on the most relevant path, which leads to shorter computation times compared to the standard ray tracing model (SRT).
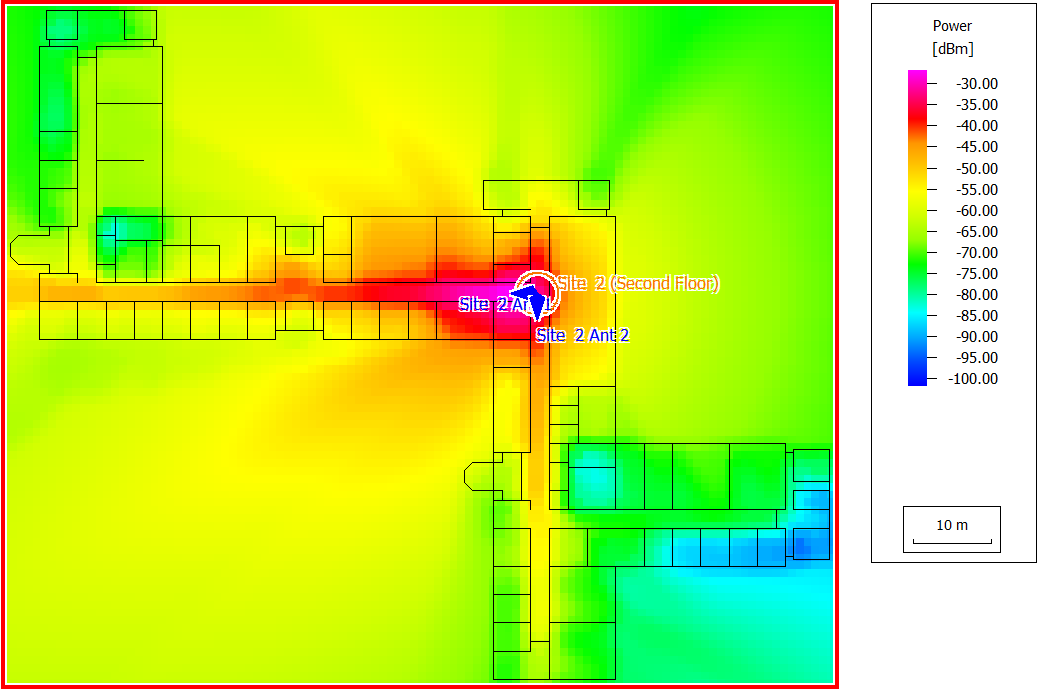
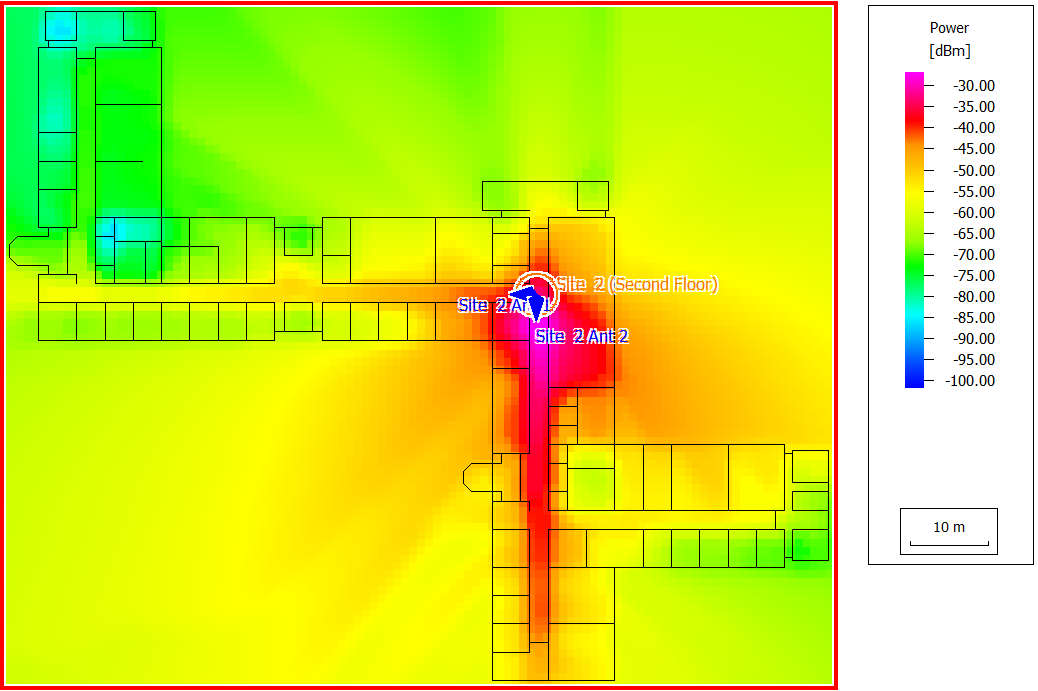
Results
- Served: The mobile is served by the cell and the corresponding radio resources are allocated for the defined application.
- Not assigned: Cell assignment not feasible for the corresponding location (signal level too low and/or SNIR too low), displayed as white pixels in a cell area map.
- Blocked (traffic): Cell assignment possible for the corresponding location and Rx power as well as SNIR sufficient for the desired transmission mode, but the required radio resources are not available in the corresponding cell (for example, codes in CDMA and time slots in TDMA).
- Blocked (quality): Cell assignment possible for the corresponding location, but for the desired transmission mode the Rx power and/or the SNIR is not sufficient (interference too high).
When a Monte Carlo simulation is performed additional reports for the traffic analysis can be generated by clicking on Monte Carlo Report under Reports in the tree.
A snippet of a Monte Carlo network simulation report is shown in Figure 4:
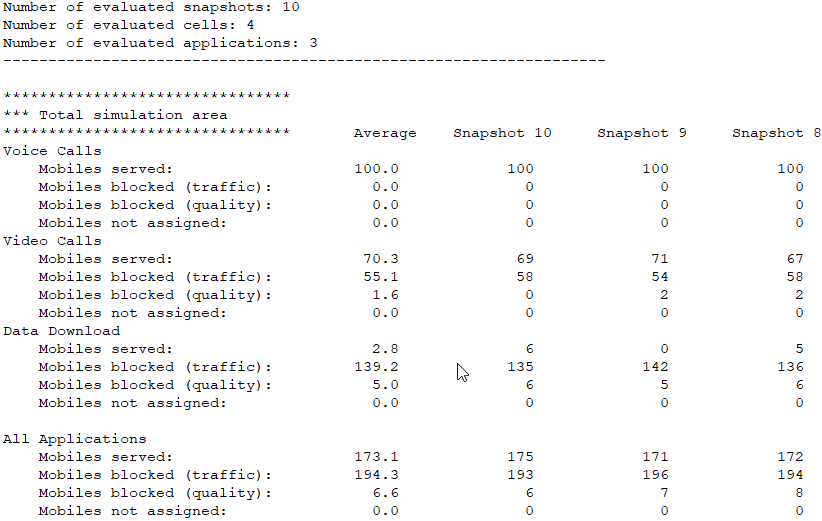
- minimum required transmitter power
- maximum receiver power
- SNIR
- reception probability
- maximum number of parallel streams at a pixel
- data rate and throughput at a pixel in transmission mode for both downlink and uplink.