The network planning of a local area network planning project in an indoor scenario
is investigated. The model is a multi-floor building. The dominant path model (DPM) method
is used.
Sites and Antennas
There are eight antenna sites at different locations and elevations in the building
for best signal coverage. Each antenna site has one isotropic antenna. They are
placed at four levels of height, that are 2.5 m, 6.2 m, 9.9 m, and 13.6 m. Four
different carrier frequencies around 2.4 GHz are used to minimize interference.
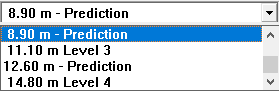
Four prediction heights are specified.
Tip: Open the Edit
Project Parameter dialog and click the
Simulation tab.
The heights are typed in the
Height field with a space between the values as
follows:
1.500 5.200 8.900 12.600
Figure 1. Selectable heights to view the prediction.
Air Interface
The wireless local area network (WLAN) air interface is defined by an 802.11g
wireless standard (.wst) file. OFDM/SOFDMA (orthogonal
frequency-division multiplexing) is selected for multiple access. It uses time
division duplex (TDD) for switching between uplink and downlink. With this
definition, only downlink carriers are defined since uplink and downlink are
separated in time. In this model, the adaptive switching method is used depending on
traffic load.
Tip: Click Project > Edit Project Parameter and click the Air Interface tab to view
the carriers and transmission modes.
Computational Method
As the model is a large multi-floor building, the preferred computation method is the
DPM. The DPM focuses on the most relevant path, which
leads to shorter computation times than standard ray tracing model (SRT).
Tip: Click Project > Edit Project Parameter and click the Computation tab to change
the model.
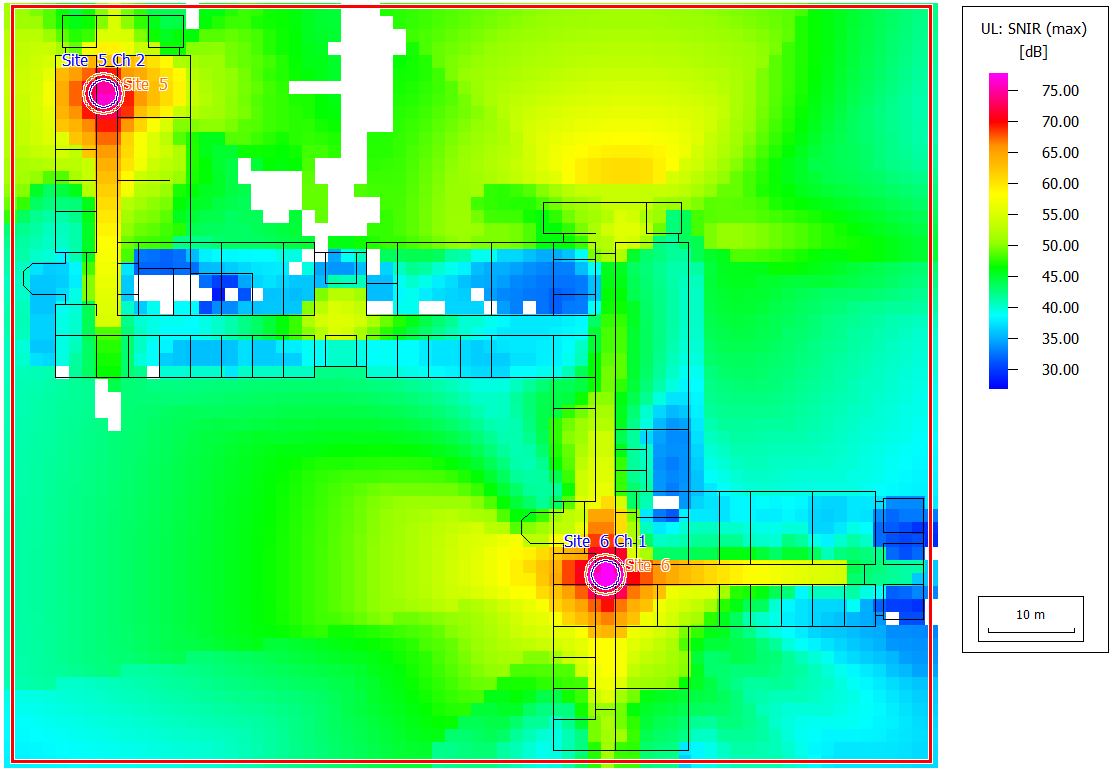
Results
Propagation results show the power received from each transmitting antenna at every
location. Results were computed for several prediction levels. When viewing results,
these levels can be selected from the drop-down list.Figure 2. Selectable height levels for the prediction.
The type of network simulation used is a static simulation (homogeneous traffic per
cell). The network simulation calculates results like cell area, site area, best
server, and maximum data rate. The network simulation calculates the maximum
receiver power and the maximum signal-to-noise-and-interference ratio (SNIR) for all
modulation and coding schemes used in this model, for both downlink and uplink.
As an example, the image below shows the uplink SNIR, at the prediction height 8.9 m,
for one of the modulation schemes.
Figure 3. Uplink SNIR for the BPSK low modulation scheme at a height of 8.9 m.