Manage Scopes in the Project Browser

Use the options in Project Browser context menu to manage scopes after running a simulation.

  1. Run a simulation and open a scope window.
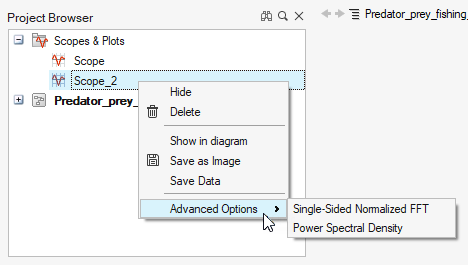
  2. From the Project Browser, right-click the scope block name and select from the following options on the context menu:


    Option Description
    Shows/Hide Shows/hides the plot that has been created.
    Delete Deletes the plot window, not the Scope block.
    Show in Diagram Highlights the selected block in the diagram.

    Save as Image Saves the plot as an image .png or .bmp file.
    Save Data Saves the data that is displayed in the plot as a .csv or .mat file. This option works for plots with and without subplots.
    Advanced > Single-Sided Normalized FFT Displays data in a frequency domain for the Scope block.

    Select the Single-Sided Normalized FFT or Power Spectral Density option, then enter a sampling frequency in the Input Dialog.

    A new window is generated with a frequency-domain plot and is named based on the primary scope window followed by FFT or PSD.


    Advanced > Power Spectral Density

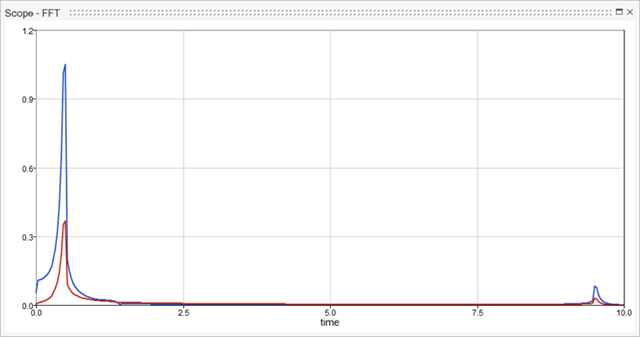
    Assumptions for the Frequency-Domain Calculation

    The initial time for the computation of the FFT and the PSD is internally set to zero:

    t=t-min (t)

    The algorithm conducts data resampling according to the sampling period, which is the inverse of the sampling frequency:

    dt= 1 fs MathType@MTEF@5@5@+= feaahGart1ev3aaatCvAUfeBSjuyZL2yd9gzLbvyNv2CaerbuLwBLn hiov2DGi1BTfMBaeXatLxBI9gBaerbd9wDYLwzYbItLDharqqtubsr 4rNCHbGeaGqiVu0Je9sqqrpepC0xbbL8F4rqqrFfpeea0xe9Lq=Jc9 vqaqpepm0xbba9pwe9Q8fs0=yqaqpepae9pg0FirpepeKkFr0xfr=x fr=xb9adbaqaaeGaciGaaiaabeqaamaabaabaaGcbaGaamizaiaads hacqGH9aqpdaWcaaqaaiaaigdaaeaacaWGMbGaam4Caaaaaaa@3B8D@
    because in most cases the signal is not sampled at a fixed frequency.

    The method to transform data from a time to frequency domain deletes time duplicates because the Twin Activate simulator may generate two or more successive data points with the same time instant.

    Some phenomena cannot be taken into account, such as aliasing and leaking, since this feature provides an introductory functionality to seamlessly visualize the data in frequency domain. For further customization of parameters in the frequency domain, OML functions for signal processing are available to be used through scripting.

    Computation of FFT

    If the number of samples is even, the formulation is as follows:

    FF T normalized = FF T original 1 , FF T original 2: N 2 2N , FF T original N 2 +1 N MathType@MTEF@5@5@+= feaahGart1ev3aaatCvAUfeBSjuyZL2yd9gzLbvyNv2CaerbuLwBLn hiov2DGi1BTfMBaeXatLxBI9gBaerbd9wDYLwzYbItLDharqqtubsr 4rNCHbGeaGqiVu0Je9sqqrpepC0xbbL8F4rqqrFfpeea0xe9Lq=Jc9 vqaqpepm0xbba9pwe9Q8fs0=yqaqpepae9pg0FirpepeKkFr0xfr=x fr=xb9adbaqaaeGaciGaaiaabeqaamaabaabaaGcbaGaamOraiaadA eacaWGubWaaSbaaSqaaiaad6gacaWGVbGaamOCaiaad2gacaWGHbGa amiBaiaadMgacaWG6bGaamyzaiaadsgaaeqaaOGaeyypa0ZaamWaae aacaWGgbGaamOraiaadsfadaWgaaWcbaGaam4BaiaadkhacaWGPbGa am4zaiaadMgacaWGUbGaamyyaiaadYgaaeqaaOWaaeWaaeaacaaIXa aacaGLOaGaayzkaaGaaiilamaalaaabaGaamOraiaadAeacaWGubWa aSbaaSqaaiaad+gacaWGYbGaamyAaiaadEgacaWGPbGaamOBaiaadg gacaWGSbaabeaakmaabmaabaGaaGOmaiaacQdadaWcaaqaaiaad6ea aeaacaaIYaaaaaGaayjkaiaawMcaaaqaaiaaikdacaWGobaaaiaacY cadaWcaaqaaiaadAeacaWGgbGaamivamaaBaaaleaacaWGVbGaamOC aiaadMgacaWGNbGaamyAaiaad6gacaWGHbGaamiBaaqabaGcdaqada qaamaalaaabaGaamOtaaqaaiaaikdaaaGaey4kaSIaaGymaaGaayjk aiaawMcaaaqaaiaad6eaaaaacaGLBbGaayzxaaaaaa@72EE@

    Where N is the number of samples of the signal. The correspondent frequency vector is:

    f= 0: 1 T : N 2T MathType@MTEF@5@5@+= feaahGart1ev3aaatCvAUfeBSjuyZL2yd9gzLbvyNv2CaerbuLwBLn hiov2DGi1BTfMBaeXatLxBI9gBaerbd9wDYLwzYbItLDharqqtubsr 4rNCHbGeaGqiVu0Je9sqqrpepC0xbbL8F4rqqrFfpeea0xe9Lq=Jc9 vqaqpepm0xbba9pwe9Q8fs0=yqaqpepae9pg0FirpepeKkFr0xfr=x fr=xb9adbaqaaeGaciGaaiaabeqaamaabaabaaGcbaGaamOzaiabg2 da9maadmaabaGaaGimaiaacQdadaWcaaqaaiaaigdaaeaacaWGubaa aiaacQdadaWcaaqaaiaad6eaaeaacaaIYaGaamivaaaaaiaawUfaca GLDbaaaaa@402C@

    If it is odd:

    FF T normalized = FF T original 1 N , FF T original 2: N+1 2 2N MathType@MTEF@5@5@+= feaahGart1ev3aaatCvAUfeBSjuyZL2yd9gzLbvyNv2CaerbuLwBLn hiov2DGi1BTfMBaeXatLxBI9gBaerbd9wDYLwzYbItLDharqqtubsr 4rNCHbGeaGqiVu0Je9sqqrpepC0xbbL8F4rqqrFfpeea0xe9Lq=Jc9 vqaqpepm0xbba9pwe9Q8fs0=yqaqpepae9pg0FirpepeKkFr0xfr=x fr=xb9adbaqaaeGaciGaaiaabeqaamaabaabaaGcbaGaamOraiaadA eacaWGubWaaSbaaSqaaiaad6gacaWGVbGaamOCaiaad2gacaWGHbGa amiBaiaadMgacaWG6bGaamyzaiaadsgaaeqaaOGaeyypa0ZaamWaae aadaWcaaqaaiaadAeacaWGgbGaamivamaaBaaaleaacaWGVbGaamOC aiaadMgacaWGNbGaamyAaiaad6gacaWGHbGaamiBaaqabaGcdaqada qaaiaaigdaaiaawIcacaGLPaaaaeaacaWGobaaaiaacYcadaWcaaqa aiaadAeacaWGgbGaamivamaaBaaaleaacaWGVbGaamOCaiaadMgaca WGNbGaamyAaiaad6gacaWGHbGaamiBaaqabaGcdaqadaqaaiaaikda caGG6aWaaSaaaeaacaWGobGaey4kaSIaaGymaaqaaiaaikdaaaaaca GLOaGaayzkaaaabaGaaGOmaiaad6eaaaaacaGLBbGaayzxaaaaaa@64F4@

    Where N is the number of samples of the signal. The correspondent frequency vector is:

    f= 0: 1 T : N+1 21 T MathType@MTEF@5@5@+= feaahGart1ev3aaatCvAUfeBSjuyZL2yd9gzLbvyNv2CaerbuLwBLn hiov2DGi1BTfMBaeXatLxBI9gBaerbd9wDYLwzYbItLDharqqtubsr 4rNCHbGeaGqiVu0Je9sqqrpepC0xbbL8F4rqqrFfpeea0xe9Lq=Jc9 vqaqpepm0xbba9pwe9Q8fs0=yqaqpepae9pg0FirpepeKkFr0xfr=x fr=xb9adbaqaaeGaciGaaiaabeqaamaabaabaaGcbaGaamOzaiabg2 da9maadmaabaGaaGimaiaacQdadaWcaaqaaiaaigdaaeaacaWGubaa aiaacQdadaWcaaqaaiaad6eacqGHRaWkcaaIXaaabaWaaeWaaeaaca aIYaGaeyOeI0IaaGymaaGaayjkaiaawMcaaiaadsfaaaaacaGLBbGa ayzxaaaaaa@44FA@

    Computation of PSD

    If the number of samples is even, the FFT and the frequency vector are calculated like it was described above, while the PSD is:

    FF T normalized = abs FF T normalized 1 2 T,0.5abs FF T normalized 2:end 2 T MathType@MTEF@5@5@+= feaahGart1ev3aaatCvAUfeBSjuyZL2yd9gzLbvyNv2CaerbuLwBLn hiov2DGi1BTfMBaeXatLxBI9gBaerbd9wDYLwzYbItLDharqqtubsr 4rNCHbGeaGqiVu0Je9sqqrpepC0xbbL8F4rqqrFfpeea0xe9Lq=Jc9 vqaqpepm0xbba9pwe9Q8fs0=yqaqpepae9pg0FirpepeKkFr0xfr=x fr=xb9adbaqaaeGaciGaaiaabeqaamaabaabaaGcbaGaamOraiaadA eacaWGubWaaSbaaSqaaiaad6gacaWGVbGaamOCaiaad2gacaWGHbGa amiBaiaadMgacaWG6bGaamyzaiaadsgaaeqaaOGaeyypa0ZaamWaae aacaWGHbGaamOyaiaadohadaqadaqaaiaadAeacaWGgbGaamivamaa BaaaleaacaWGUbGaam4BaiaadkhacaWGTbGaamyyaiaadYgacaWGPb GaamOEaiaadwgacaWGKbaabeaakmaabmaabaGaaGymaaGaayjkaiaa wMcaamaaCaaaleqabaGaaGOmaaaaaOGaayjkaiaawMcaaiabgEHiQi aadsfacaGGSaGaaGimaiaac6cacaaI1aGaey4fIOIaamyyaiaadkga caWGZbWaaeWaaeaacaWGgbGaamOraiaadsfadaWgaaWcbaGaamOBai aad+gacaWGYbGaamyBaiaadggacaWGSbGaamyAaiaadQhacaWGLbGa amizaaqabaGcdaqadaqaaiaaikdacaGG6aGaamyzaiaad6gacaWGKb aacaGLOaGaayzkaaWaaWbaaSqabeaacaaIYaaaaaGccaGLOaGaayzk aaGaey4fIOIaamivaaGaay5waiaaw2faaaaa@76FC@

    Where N is the number of samples of the signal.

    If it is odd, the FFT and the frequency vector are calculated like it was described above, while the PSD follows the same formula as if the number of samples was even.

    Where N is the number of samples of the signal.