
Plot Assistant
Use the Plot Assistant to explore additional representations of results that can be added to the finalization script.
-
From the Tools ribbon, select the Plot
Assistant.
 The Plot Assistant appears with tabs for plotting data from a delimited file, such as a .csv, or your OML workspace. The 2D line plot is generated on startup using data from the demo_line.csv file.
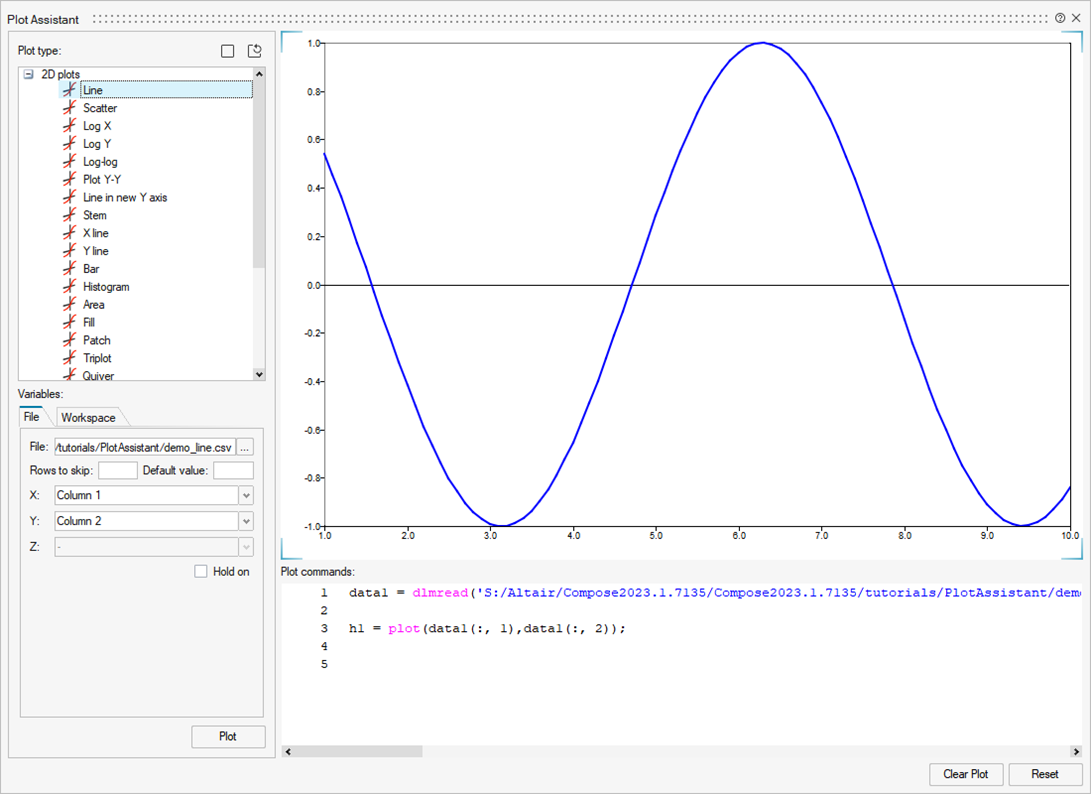
-
Select the data to plot:
To Plot from Do this Delimited file Select the File tab. Any headers in your file are automatically populated in the list of variables: 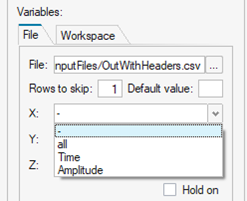
Otherwise, the column number is displayed: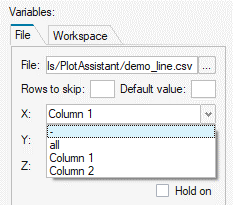
Options include:- Rows to skip: The number of rows from the beginning of the file that dlmread does not read. This is useful when a file contains multiple lines of headers before the numeric data. The Plot Assistant tries to determine the number of rows to skip automatically when a file is selected.
- Default value: The value to be used in the output for empty or non-numeric values of the input file. If left empty, the value is set to 0.
OML Workspace Select the Workspace tab, then select the desired numerical variables for X, Y and Z. 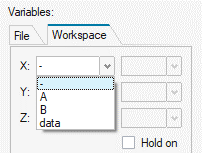
If you select a matrix variable, choose the column to plot: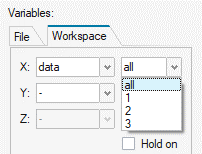
-
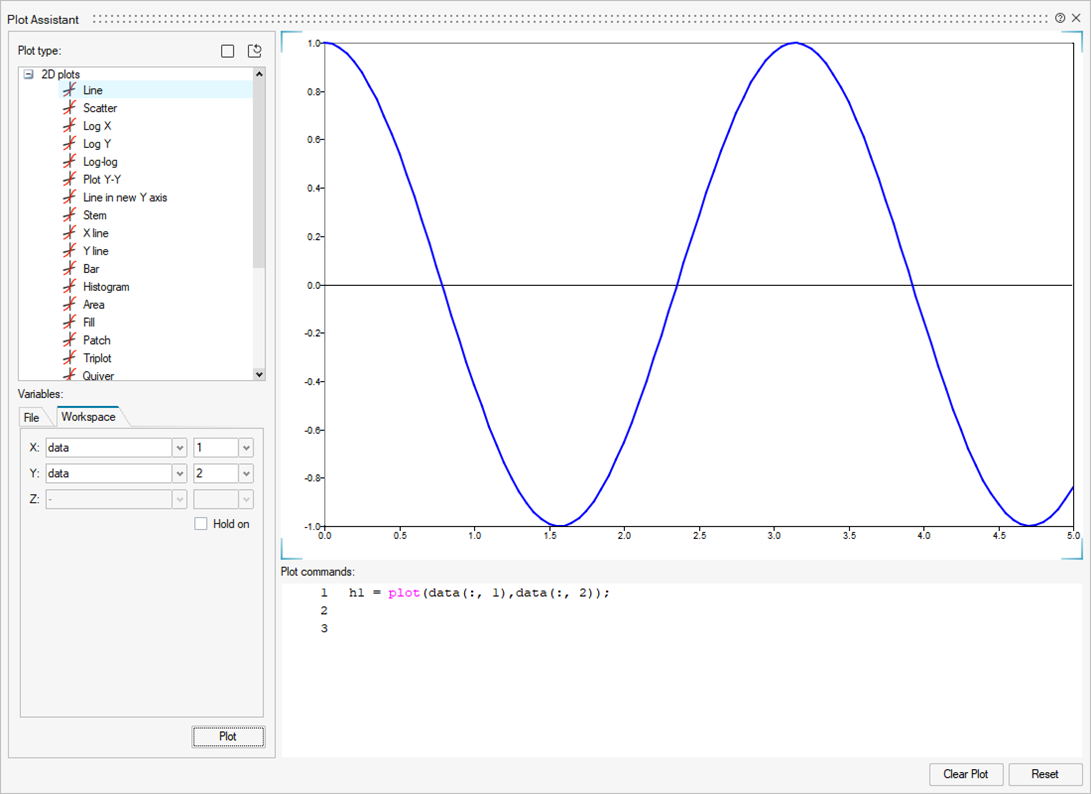
Click the Plot button.
The plot is created based on your data selections:
 Note: If the File tab is selected and the values of the Rows to skip or Default value fields have changed, when you click the Plot button, the file is reloaded. If the file has changes since the last time it was loaded, you are prompted to select whether to reload the file or use the data already loaded in the Plot Assistant.
 -
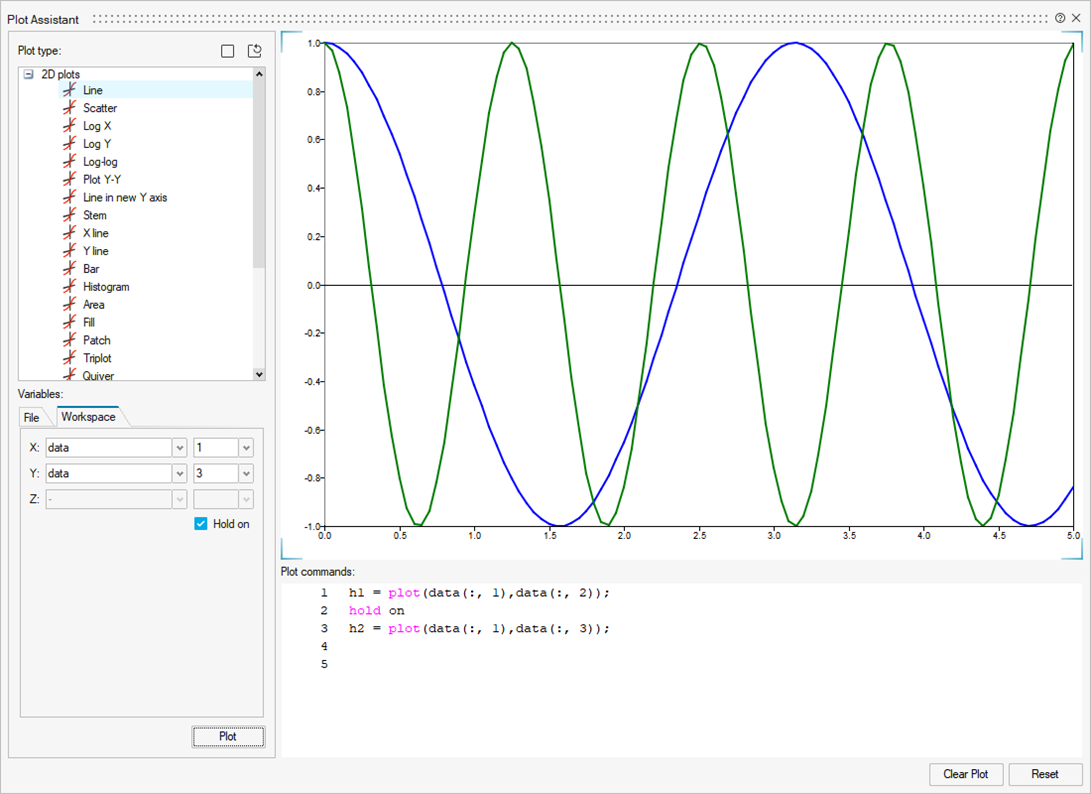
To add a curve to the plot, select Hold on, select a new
variable from the workspace or file, then click Plot
again.
-
To modify a curve display, right-click the curve and use the options in the
microdialog to make your changes.
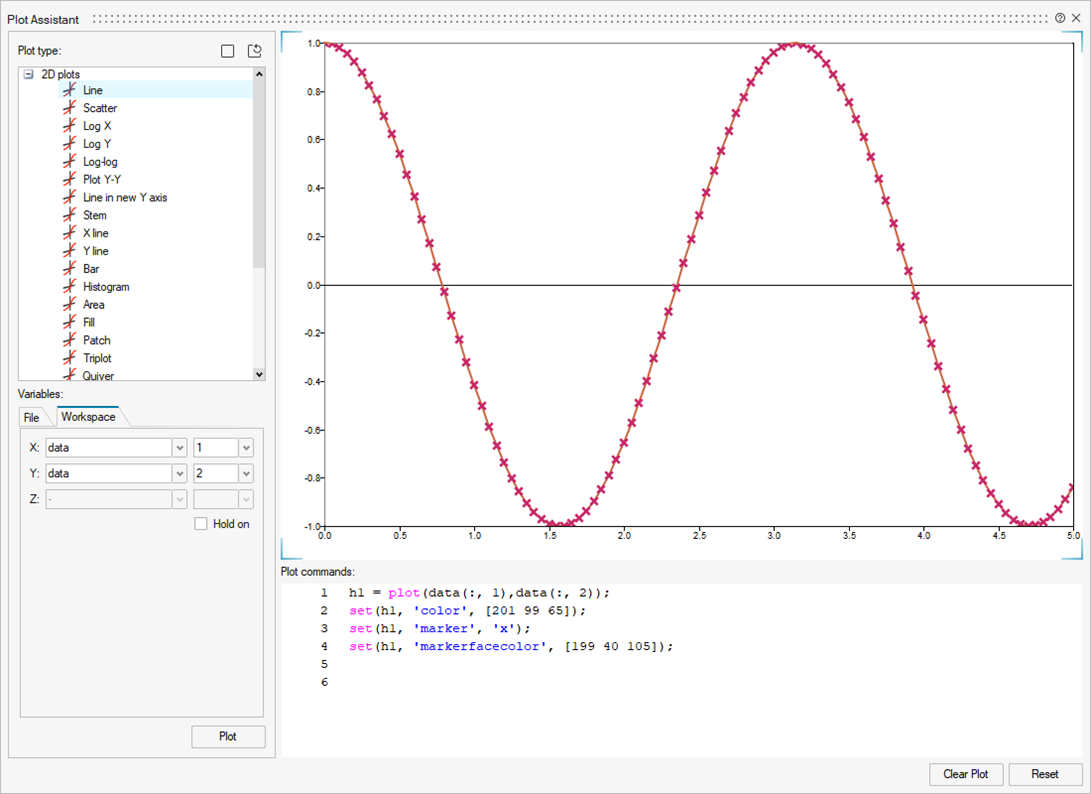
When you modify a plot, the Plot Commands window is updated to reflect the changes. For each change you make in a microdialog, a new
setcommand is added at the end of the Plot Commands. If a property has already been changed and has an entry in the Plot Commands, when you make a new change, the previous entry is removed and a new entry is added at the end of the commands.Some properties will trigger the change of other properties. For example, if you change the axis type from
LineartoLogarithmic, notice that the number of ticks also changes.There are some options in the microdialog that do not have an equivalent property to
set:- "Diagonal labels" in 2D bar plots.
- "Bar labels numeric format", "Bar labels numeric precision" in 2D bar plots.
- "Assign to axis" in 2D line plots.
The microdialog used for
scatter,area,patchandquiveris the same as the microdialog for lines, but the properties are different. For example, in a scatter plot, you can change the line color or line style in the microdialog, but the scatter element doesn't have thecolorandlinestyleproperties.The context menu of the OML Commands menu offers additional options aside from the standard Copy and Select All options:- Run Selection: Evaluates the selected commands.
- Copy to Editor: Copies the selected commands in the active OML script editor.
If an OML script editor does not exist, or if one exists but is not active, a new OML script editor is created and the commands are pasted.
Note: If you run xline, yline, or addaxis commands in an OML script or in the OML Command Window, a line is added in an existing plot. In the Plot Assistant, the plot is cleared before plotting an xline or yline unless the Hold on check box is disabled and selected when you select one of these commands to match the behavior of the commands in the OML script or the OML Command Window. -
To create a subplot, click the Configure plot layout
icon and select one of the predefined layouts.
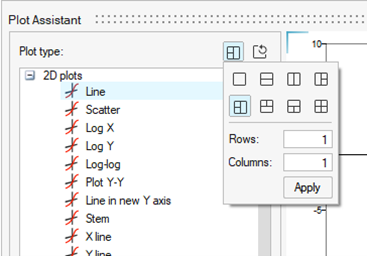 Alternatively, you can type the number of rows and columns and click Apply. The maximum number of rows and columns is four.To plot on a specific subplot, click on it. The blue lines on the subplot corners indicate the active subplot.
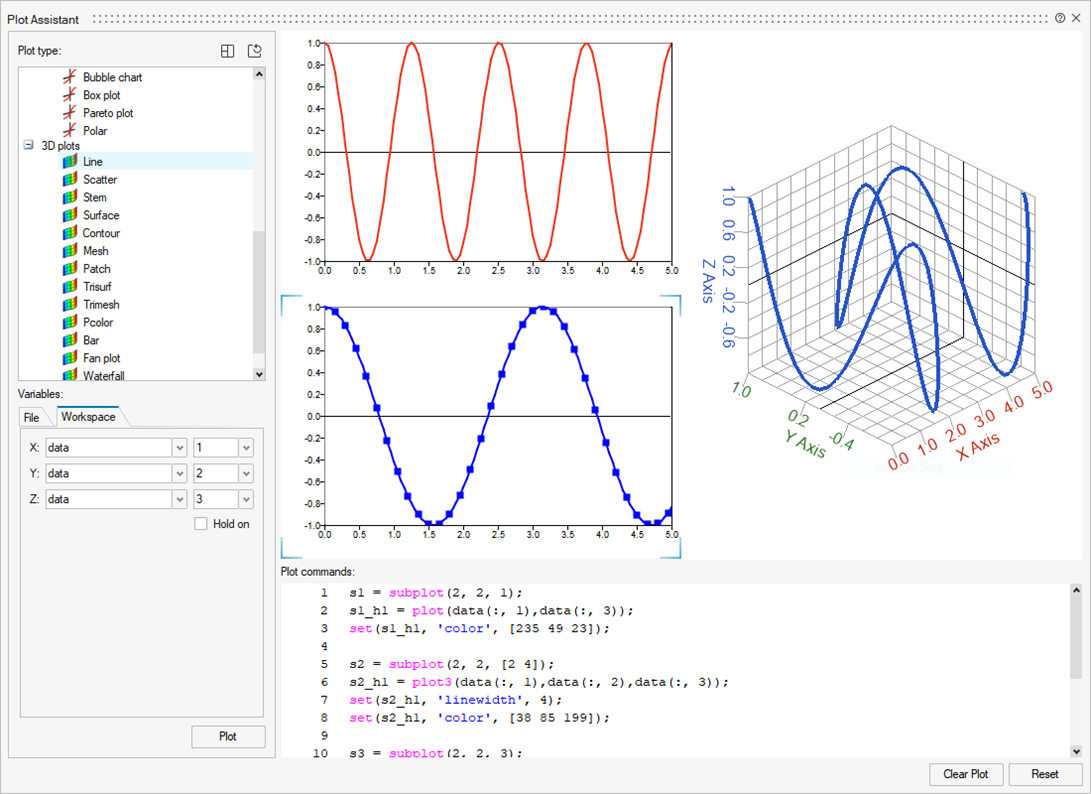 In the Plot commands window, the commands are grouped per subplot.
 -
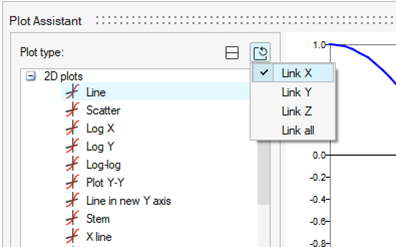
To link the subplot axes, click the Link subplot axes
icon and select one or more axes.
Click Link all to select or deselect all the axes.The selected axes are linked and synced between subplots. For example, if Link X is selected and you zoom in and out, or otherwise change the X axis range on one subplot, then the same range change is applied to the X axis of the other subplots. The Z axis is ignored in 2D plots.
- To clear the active plot and its plot commands without changing the Plot type or Variables, click the Clear Plot button.
- To clear the Plot Assistant interface and reset it to its initial state, click the Reset button. If the File tab is selected, the demo file is restored and the plot and plot commands are generated.