Curves are comprised of an X data vector and a Y data vector. The X and Y vectors can be
read from a data file, defined as mathematical expressions, or entered as values. The X
and Y vectors of a curve do not have to come from the same source. For instance, the
data source for the X vector of a curve can be an ASCII file and the source for the Y
vector of the same curve can be defined by an expression such as
sqrt(x).
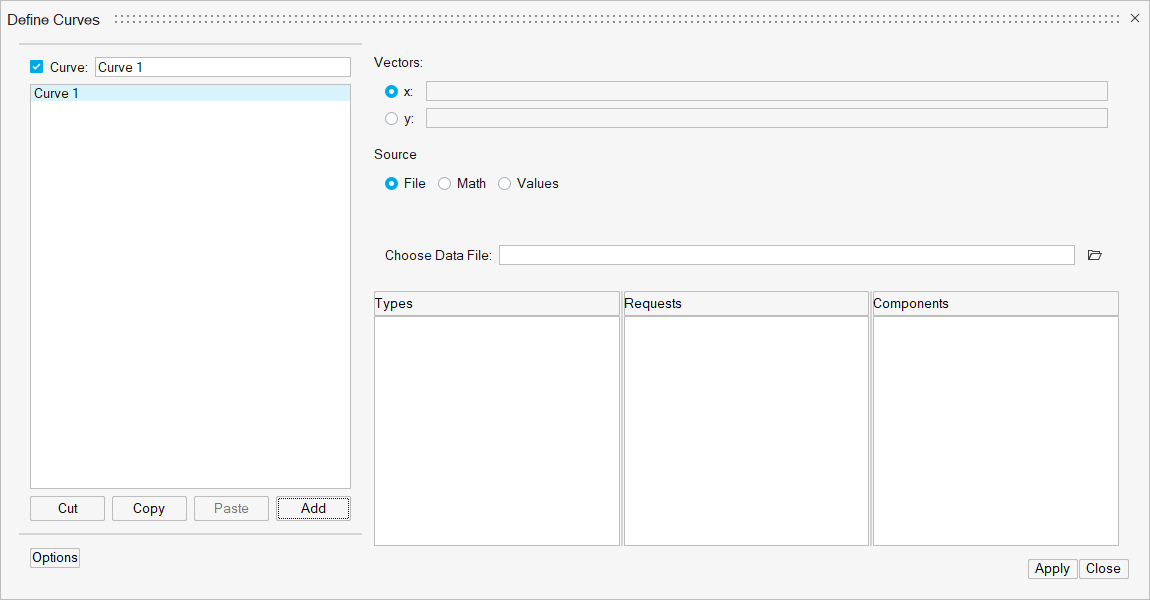
File as a Data Source
If you select File as the data source, use the file browser to
select data files for the X and Y vectors. From the list view, select the subcases,
types, requests, and components.Figure 1.
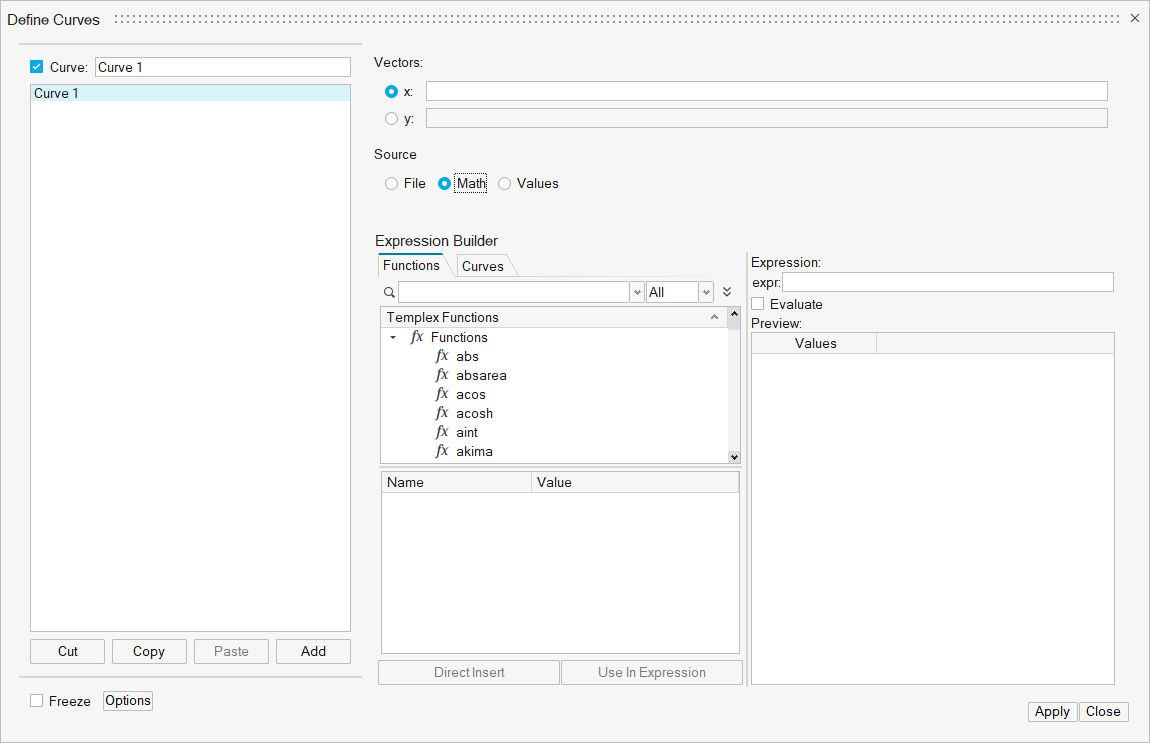
Math as a Data Source
If Math is selected as the source, the Expression Builder is
displayed, allowing you to define the vector mathematically.
Math as a source allows you to use additional curve vectors to plot a curve. In
addition to the traditional X and Y vectors, you can use U and V vectors to perform
operations on a curve at plotting time. As a result, only one curve is generated in
the session. This is helpful any time that you want to create a curve and
immediately apply a function (for example, a filter) to that curve.Figure 2.
Expression Builder
Curves can be defined mathematically using the Expression
Builder.
The Expression Builder is displayed when Math is
selected as the data source for a vector.
The Expression Builder contains the math functions necessary to build an
expression. Use the in-app Entity Editor to
select parameters as arguments for the selected Templex functions.
Direct Insert
Select a Templex function from
the list and use Direct Insert to
place it directly into the vector field.
Use In Expression
Select a function from the list and select Use in
Expression to build a large expression,
placing the function in the expression field.
You can evaluate and check the function values in a tabular form.
Once the expression is constructed, click Apply
to place the expression in the vector field and plot the curve.
In the preferences file, use
*RegisterExternalFunction() and
*RegisterTemplexFunction() to register external
functions or Templex functions in HyperGraph. You can insert any of the functions
into the current expression by selecting the function name from the list
or by typing the name directly into the equation.
See the List of Standard Functions topic in the Math
Reference for a detailed description of each function and its
purpose.
External Functions
In addition to the built-in math functions and operators, external
C-programs can also be called from within a math expression.
Calling an external function enables you to process plot data from
within the program using your own set of specialized programs. For
example, the external program can be a customized filter for
manipulating plot data or a program that passes plot data to another
application for processing.
External programs must be registered in the preferences file before they
can be called from within a math expression. Registering an external
program associates the program file with a function name. External
programs can be registered in your own preferences file or in the global
preferences file, making it available to everyone on the network.
See the Altair IPC for more information on writing and calling
external C-programs from within a math expression.
See the *RegisterExternalFunction() statement in Preference Files
help for more information on registering external functions in the
preferences.mvw file.
Freezing Vectors
When a vector is defined by an expression, the program automatically
recalculates the vector each time the expression is altered, updating
the curve. If an expression contains a reference to another curve and
the referenced curve changes, the program recalculates the vector and
updates the curve containing the reference.
Vectors can be frozen so
that the program does not recalculate the curve. When a vector is
frozen, it is no longer dependent on a referenced curve, so changes
made to other curves are not reflected in the frozen vector. Vectors
can be unfrozen, making them once again subject to change. The X and
Y vectors can be frozen independently of each other or together,
freezing the entire curve. Frozen vectors are saved as data point
values in session files.
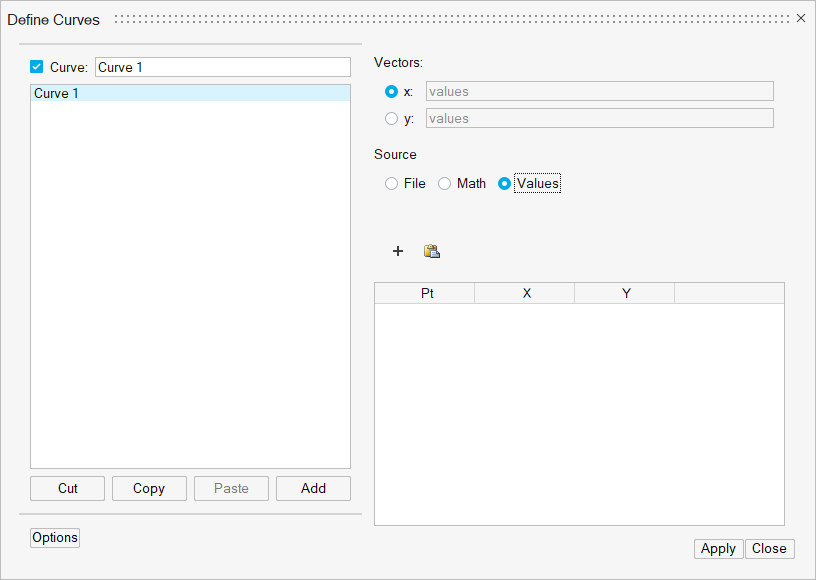
Values as a Data Source
If Values is selected as the source, a table is displayed.
Enter data point values to the table directly.Figure 3.