Math
Create macros that produce curves and notes for plots.
A plot macro can include either a curve, note, or both. Plot macros can be used to capture and replay frequently used curve operations, such as adding two curves together, filtering curves, or filtering and then curve fitting data. They can also be used for frequently used plot notes. You can create and edit plot macros in HyperGraph or load them automatically by registering them in a preference file.
When plot macros are added using Plot Macros, they are saved in the session file. When plot macros are added to the preference file, they cannot be edited in Plot Macros and are not saved to the session file.
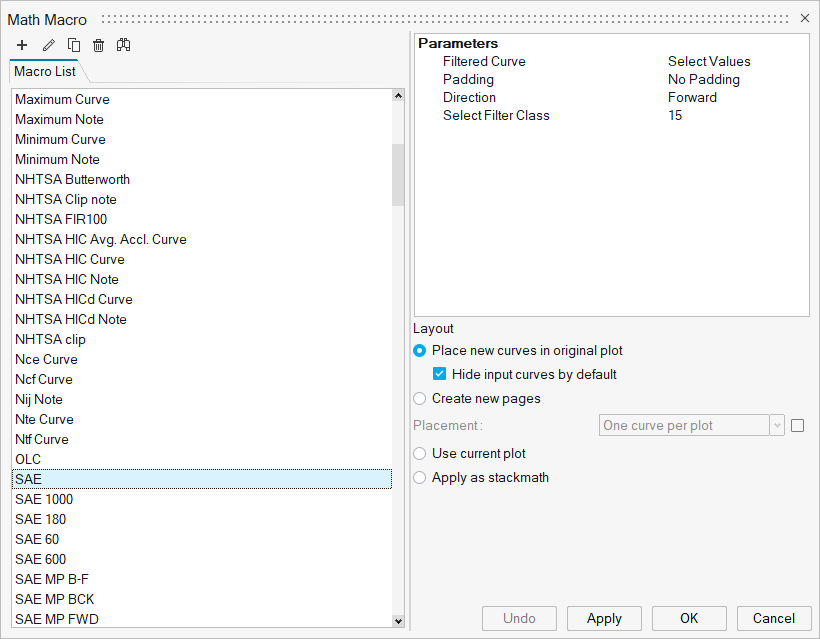
Macro List and Parameters
The Macros list contains all plot macros in the current session.
Selected macros can be cut, copied, and pasted.
The parameters associated with the selected macro are displayed in the Parameters list. Parameters can be either curve or scalar. Curve parameters are displayed as collectors. Click on a collector to graphically select a curve from a plot. Double-click on a collector to display the Select Curve dialog. Scalar parameters are displayed as text boxes. Parameters are usually used to collect curves from within the session to use in mathematical expressions. The result calculation can utilize any math function, including Templex functions and external functions. Macros support multiple arguments for parameters.
Edit Plot Macros
From the Math Macros dialog, you can add new plot macros to a session and edit the curves and notes for existing plot macros.
- Add

- Click to add a new macro to the list.
- Edit

- Click to edit an existing macro.
- Copy/Paste

- From the Macro List, select a macro and click to create a copy.
- Delete

- From the Macro List, select a macro and click to
remove it from the list.
- Find

- Click to search the macro list.
-
Figure 3. 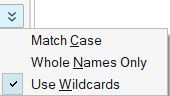
- Parameter
- Add or edit parameters for plots and notes.
- Curve
- Add or edit a plot macro curve.
- Note
- Add or edit a plot macro note. Notes can be attached to windows, views, existing curves, coordinates, and curves created by the macro.
Upon completion, click to return to exit the add and edit modes and return to the main dialog options.
Layout
Under Layout, use the following options to control the placement of the resulting curves.
- Place new curves in original plots
- Inserts the resultant curve(s) in original plots. The created curves are associated to the original curve's axis.
- Create new pages
- Places resultant curve(s) on a new page. When creating curves from Plot
Macros, the created curves are associated to the same axis as the
selected curves.
- Placement
- Select from One curve per plot or One plot.
- Use current plot
- Places all resultant curve(s) in current plot.
- Apply as stackmath
- Selecting this option does not create a duplicate curve, and the math is applied on the selected curve.
The plot macro uses the parameters to create curves and notes within the session.
Click Apply to apply a plot macro.
Click Undo to reverse the plot macro.