Retrieves individual point data on any curve in the active window. When a point is
selected, the point data is displayed in the dialog.
From the Line Chart ribbon, click the Values tool.Figure 1. Figure 2.
There are three ways to retrieve point data from a curve:
Pick a point on a curve.
Locate a point using the Navigation Options.
Select a point from the point list.
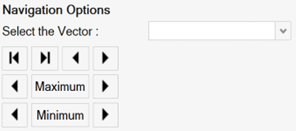
Navigation Options
The range boundaries can also be picked using the Navigation Options.Figure 3.
Click
To Find
Navigate to the first or last point on the curve.
Navigate to the previous or next point on the curve.
Maximum
The global maximum of the curve.
For other chart types:
The global maximum of the curve across all frequencies of
points.
HyperGraph moves the cursor the
maximum magnitude value, which is the maximum value from the
center of the polar plot and across all frequencies for vector
plots.
The previous and next local maximum.
For other chart types:
The next local maximum in the previous or next frequencies for
vector plots.
The next or previous local maximum point for phase/magnitude and
radar plots.
HyperGraph moves to the next peak
with respect to the center of the polar plot.
Minimum
The global minimum of the curve.
For other chart types:
The global minimum of the curve across all frequencies or
points.
HyperGraph moves the cursor the
minimum magnitude value, which is the minimum value from the
center of the polar plot.
The previous and next local minimum.
For other chart types:
The next local minimum in the previous or next frequencies.
HyperGraph moves to the next peak
with respect to the center of the polar plot.
Select the Vector
The corresponding point on the next curve.
For other chart types:
The same frequency on the next curve for vector plots.
The same phase on the next curve for phase/magnitude and radar
plots.
Point Table
The point table displays the XY data points, or the phase and magnitude data points,
for the selected curve. The following information is displayed in the point
table:
The point number.
The X-value and the Y-value for the selected point.
The phase-value and the mag-value for each point.
Use the scroll bars to view the entire list. Click on a point in the table to
display the point data on the curve.
For vector plots, frequency is included in the value table.
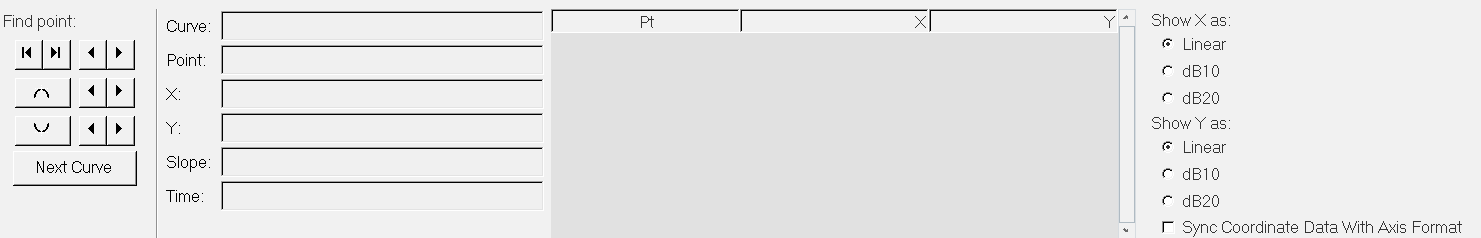
Point Data
The following data is displayed when a point is picked from the point table:
Curve
The name of the curve.
Point
The number of the data point.
Theta (Curve-dependent)
The theta value of the data point.
X
The X value of the data point.
Y
The Y value of the data point.
r (Curve-dependent)
The r value of the data point.
Slope
An estimate of the slope of the curve at the selected point.
Time
The time step of the data point (if available).
Freq (Curve-dependent)
The current animation time step (frequency) and not the frequency of the
picked point.
Phase in the table is shown in degrees.
Displaying Point Data with Scaling Options
Under Scaling Options, select the vector to display the point data.
Linear
db10, to display data in decibels
db20, to display data in decibels
Select Sync Coordinate Data with Axis Format
to show coordinate info
curve values in the same format (scientific, fixed) as used by the axis. See the
Axes panel for more information on defining the axes.