Visualize Trade Offs and Predicted Results
Predict response values or entire results from different design variable choices.
-
From the Design Explorer ribbon, Evaluate tool group, click the
Results Explorer tool.
Figure 1. 
The Results Explorer Browser opens. -
In the Results Explorer Browser, click
 Trade-Off.
Figure 2. 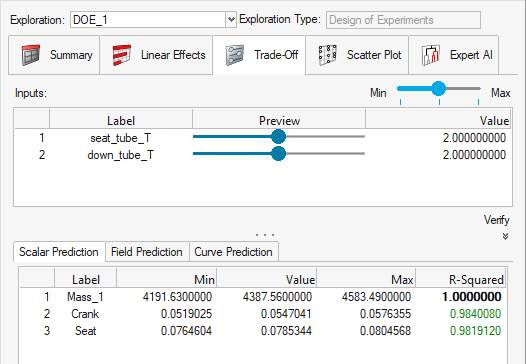
The Trade-off panel is divided into four areas: Inputs, Scalar Prediction, Field Prediction, and Curve Prediction.
- Inputs
- Each row in the Inputs area corresponds to an input or design variable in the exploration. Moving the sliders, or keying in values in the Value column, sets the desired value for the given design variable.
- Scalar Prediction
- Predicted response values are shown based on a response surface fit automatically generated for every DOE.
- Field Prediction
- Using advanced machine learning techniques, predicted results are calculated and contoured for the entire model.
- Curve Prediction
- Predicted curves are calculated based on response selection and defined inputs or design variables.
- In the Inputs area, move the sliders to the desired values, or type values into the Value column.
-
Review the predicted response values in the Scalar Prediction tab.
Note:
- The Min and Max values in the indicate the minimum and maximum sampled values for the given responses based on the DOE results.
- The R-Squared value is a statistical representation of the quality of a given response fit based on cross validation. R-Squared values are color-coded to indicate the level of confidence that should be attributed to a given fit. The trade-off tool is very useful for showing trends. It is recommended that a verification run be performed to validate a predicted response.
-
Predict results.
- In the Field Prediction tab, right-click a response and select Train.
- Select any trained response and click Predict.
Using advanced machine learning techniques, predicted displacement results are calculated and contoured for the entire model. With the Predict button active, moving the input sliders will calculate new predicted results, generating an updated contour without needing to run additional solver jobs. You can use deformed shape and animation controls to further interrogate the predicted results.Note:- The prediction feature requires the EngDataSciFieldPredict license feature.
- To use the Predict button, you have to have selected Generate Reports - Field Prediction in the Evaluate dialog when evaluating the exploration. Or, you can click Generate FP Report to generate a new report based on the exploration results. Depending on the model size and number of runs, this may take several minutes.
- In the Curve Prediction tab, select one or multiple responses for Data Source.
- In the Inputs area, move the sliders to the desired values, or type values into the Value column to manipulate the curve.
- Optional:
Click the Verify button, Export,
and Run a verification.
A verification is an exploration where a single solver job is run with the input design variable values set as they were in the trade-off panel.
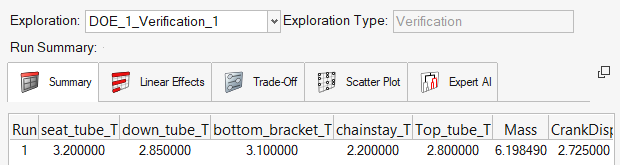
Figure 3. 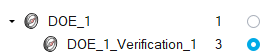
Results for the verification exploration run can be used to verify the predictions. The results can be viewed in the Results Explorer by setting the verification exploration as the exploration.Figure 4.