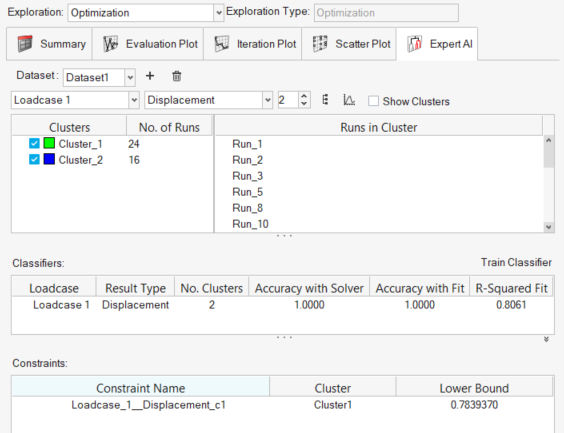
Click Train Classifier to create a classifier based on
the current clustering.
A trained classifier is listed, along with the following information
shown in the table:
Accuracy with Solver
Indication of the expected accuracy when running a solver-based
optimization.
Accuracy with Fit
Indication of the expected accuracy when running a fit-based
optimization.
R-Squared Fit
Representation of the quality of the fit.
Right-click the classifier and select Create
Constraint.
Select a cluster to use as the constraint and enter a lower bound for the
constraint.
The subsequent optimization will attempt to satisfy the constraint such that
the optimal result will conform to the selected cluster with probability greater
than the constraint value.
Click Optimize and choose the desired optimization type
to run.
Note: The optimization will use design variables and responses, including goals,
from the original exploration the clusters were generated from. An objective
is required to run the optimization.
When the originating exploration type
is a DOE, both fit-based and solver-based optimizations can be run. When
the originating type is an optimization, only solver-based optimizations
can be run.
Visualize Clusters
There are a number of tools and features to help with interrogation and visualization
of cluster information.
Click to display the dendrogram for
a given clustering.
A dendrogram is a visual tool which shows the hierarchical relationship
between clusters.
Tip: Click Save to save an
image of the dendrogram.
Click to display a silhouette plot
for a given clustering.
The silhouette plot provides an indication of the validity and consistency
within the clustering and how well each run has been classified.
Select the Show Clusters check box to color the runs on
an active scatter plot by cluster.
Right-click on a cluster and select Animate
Cluster.
This loads an animation in the active HyperView
client (if the active client is not a HyperView
client, a new one is opened), overlaying the final deformed shape of each run in
the selected cluster. This can be useful for visualizing the deformed shape of
the given cluster as a whole.
Right-click on a cluster or in the white space of the Clusters column and
select Animate all Clusters.
This creates a new page and loads an animation for each cluster in a new
HyperView client, overlaying the final deformed
shape of each run in each cluster. This can be useful for visualizing the
deformed shape of each cluster as a whole and comparing one cluster to
another.
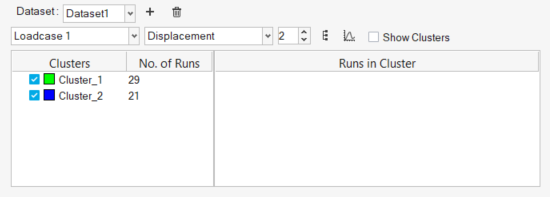
Select a cluster in the Clusters column, and the runs comprising that cluster
are displayed in the Runs in Cluster column. Select one or more runs in the Runs
in Cluster column, right-click, and select Overlay
Selection.
This will load an animation in the active HyperView client (if the active client is not a HyperView
client, a new one is opened), overlaying the results, including all timesteps,
of each of the selected runs.

 ExpertAI.
 to create a new dataset.
 to display the dendrogram for
a given clustering.
A dendrogram is a visual tool which shows the hierarchical relationship between clusters.Tip: Click Save to save an image of the dendrogram.
to display the dendrogram for
a given clustering.
A dendrogram is a visual tool which shows the hierarchical relationship between clusters.Tip: Click Save to save an image of the dendrogram. to display a silhouette plot
for a given clustering.
The silhouette plot provides an indication of the validity and consistency within the clustering and how well each run has been classified.
to display a silhouette plot
for a given clustering.
The silhouette plot provides an indication of the validity and consistency within the clustering and how well each run has been classified.