An Mx3 matrix, where M is the number of triangles. Each row contains the indices of a
triangle in the x, y and z
matrices. Usually, tri is the output of the
delaunay function.
Type: integer
Dimension: vector | matrix
x, y, z
Coordinates of the vertices.
Type: double | integer
Dimension: vector | matrix
cdata
Color data for each vertex or triangle. cdata can be:
a vector that contains a scalar value for each vertex
a vector that contains a scalar value for each triangle
an Mx3 matrix that contains an rgb color for each triangle
Type: double | integer
Dimension: vector | matrix
property
Properties that control the appearance or behavior of the graphics object.
Type: string
Dimension: scalar
value
Value of the properties.
Type: double | integer | string
Dimension: scalar | vector
hAxes
Axis handle.
Type: double
Dimension: scalar
Outputs
h
Handle of the trisurf graphics object.
Examples
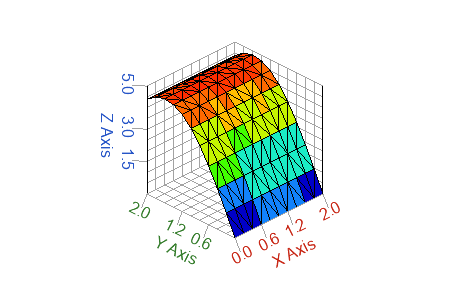
Simple trisurf example:
[x, y] = meshgrid([0:0.2:2]);
z = sin(x)'*cos(y);
tri = delaunay (x(:), y(:));

figure;
h = trisurf(tri, x, y, z);
Figure 1. Simple trisurf example
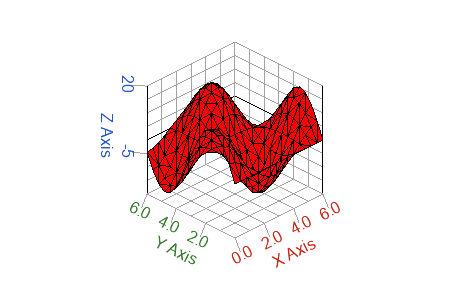
Set trisurf facecolor:
[x, y] = meshgrid([0:0.4:2*pi]);
z=sin(x')*cos(x);
tri = delaunay (x(:), y(:));

figure;
h = trisurf(tri, x, y, z);
set(h,'facecolor','r')
Figure 2. trisurf color
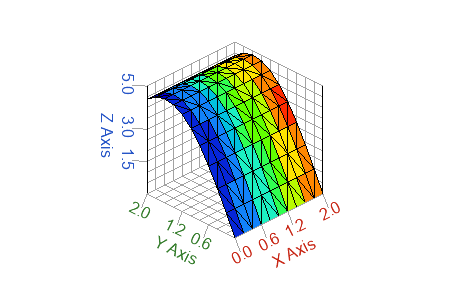
Set cdata per vertex:
[x, y] = meshgrid([0:0.2:2]);
z = sin(x)'*cos(y);
tri = delaunay (x(:), y(:));
figure;
% cdata is a scalar per vertex
cdata = x(:);
h = trisurf(tri, x, y, z, cdata);
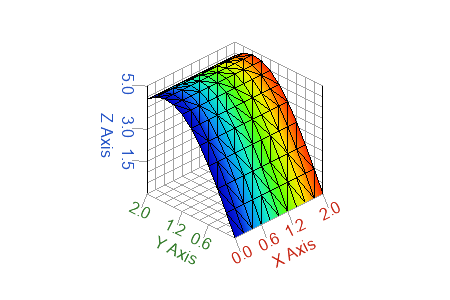
figure;
h = trisurf(tri, x, y, z, cdata);
% the triangle color is interpolated
set(h, 'facecolor','interp');
Figure 3. cdata per vertex Figure 4. cdata per vertex, color is interpolated
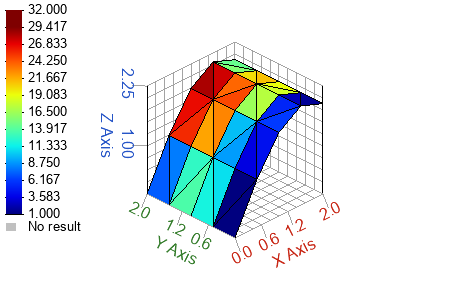
Set cdata per triangle:
[x, y] = meshgrid([0:0.5:2]);
z = cos(y)'*sin(x);
tri = delaunay (x(:), y(:));
figure;
% cdata is a scalar per triangle
cdata = 1:size(tri)(1);
h = trisurf(tri, x, y, z, cdata);
colormap(jet(12))
colorbar;
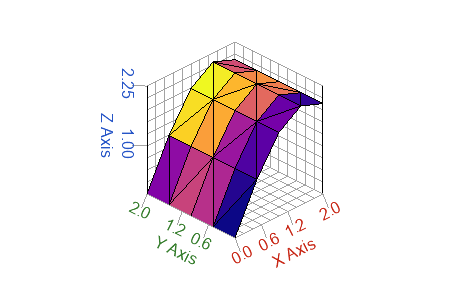
figure;
% cdata is an rgb color per triangle
cdata = plasma(size(tri)(1));
h = trisurf(tri, x, y, z, cdata);
Figure 5. Scalar cdata per triangle Figure 6. RGB color per triangle