
linkaxes
Links and synchronizes the range of axes between plots.
Syntax
linkaxes(h-vector, option)
Inputs
- h-vector
- Vector of axes handles to link.
- option
- Specifies the axis to link. Valid values are: 'x', 'y', 'z', 'xy', 'xz', 'yz', 'xyz' and 'off'. Option 'off' may be used to disable axes linking. If option is omitted, default value 'xyz' is used.
Examples
Link x axes example: Figure 1. Link x axes
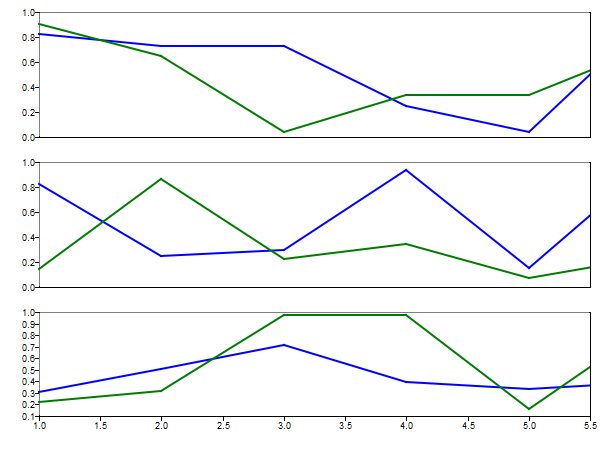
figure;

ax1 = subplot(3, 1, 1);
plot(rand(10,2));

ax2 = subplot(3, 1, 2);
plot(rand(10,2));

ax3 = subplot(3, 1, 3);
plot(rand(10,2));

linkaxes([ax1, ax2, ax3], 'x');
set(ax1,'xvisible','off')
set(ax2,'xvisible','off')

xlim([1 5.5]);Link y axes example: Figure 2. Link y axes
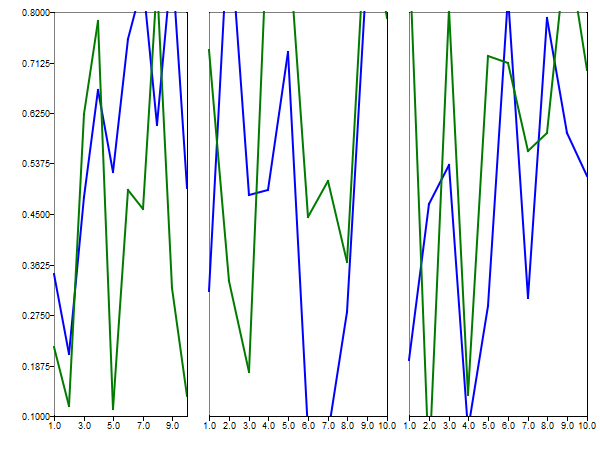
figure;

ax1 = subplot(1,3,1);
plot(rand(10,2));

ax2 = subplot(1,3,2);
plot(rand(10,2));

ax3 = subplot(1,3,3);
plot(rand(10,2));

linkaxes([ax1, ax2, ax3], 'y');

set(ax2,'yvisible','off')
set(ax3,'yvisible','off')

ylim([0.1 0.8]);Link all axes example: Figure 3. Link all axes
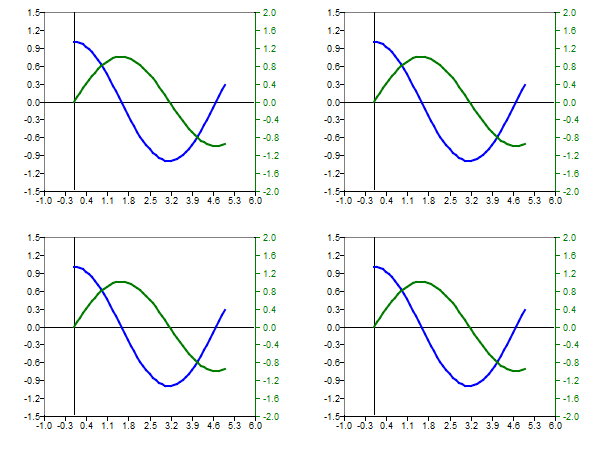
x = 0:0.1:5;
y = cos(x);
y1 = sin(x);

figure;
ax1 = subplot(2, 2, 1);
plot(x, y);
axSec1 = addaxis(x, y1);

ax2 = subplot(2, 2, 2);
plot(x, y);
axSec2 = addaxis(x, y1);

ax3 = subplot(2, 2, 3);
plot(x, y);
axSec3 = addaxis(x, y1);

ax4 = subplot(2, 2, 4);
plot(x, y);
axSec4 = addaxis(x, y1);

linkaxes([ax1, ax2, ax3, ax4]);
linkaxes([axSec1(2), axSec2(2), axSec3(2), axSec4(2)], 'y');

xlim([-1 6]);
ylim([-1.5  1.5]);
ylim(axSec1(2), [-2 2]);Link 3d plot axes example: Figure 4. Link 3d plot axes
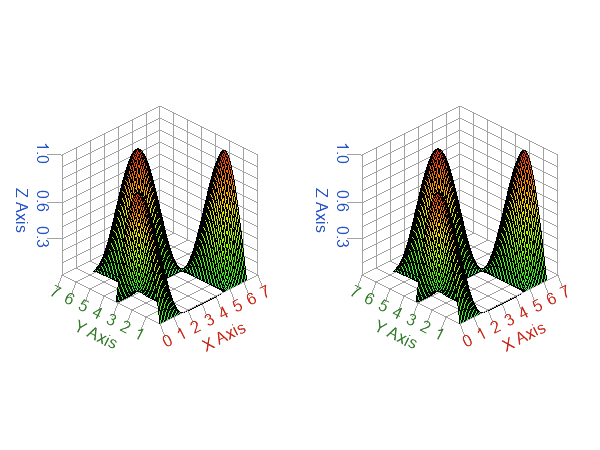
x=[0:0.1:2*pi];
y=x;
z=sin(x')*cos(y);

figure;
ax1 = subplot(1,2,1);
surf(x, y, z);

ax2 = subplot(1,2,2);
surf(x, y, z);

linkaxes([ax1, ax2], 'z');

zlim([0 1]);Comments
linkaxes can be used for axes in different figures.
The axis range of the first handle in h-vector will be applied to all linked axes when linkaxes is called.