
caxis
Sets/gets the colorbar range.
Syntax
caxis([cmin cmax])
caxis('auto')
caxis(hAxes, ...)
[cmin cmax] = caxis(...)
Inputs
- cmin, cmax
- Lowest and highest ranges.
- 'auto'
- Option 'auto' will reset the color axis range to fit the color data of the plotted surface.
- hAxes
- Handle of the axes.
Outputs
- cmin, cmax
- Current range of the colorbar.
Example
Simple caxis example:Figure 1. Set colorbar range using caxis command 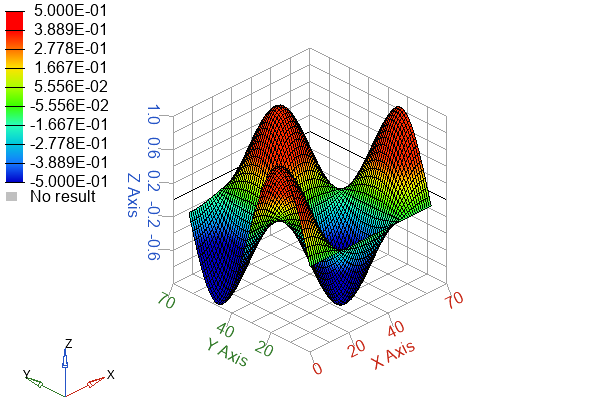
cla;
x=[0:0.1:2*pi];
y=x;
z=sin(x')*cos(y);
surf(z);
caxis([-0.5 0.5]);Comments
cmin, cmax specify the values assigned to the first and last color in the colormap. Data values lower or higher than cmin/cmax will be assigned the lowest/highest color of the colormap, respectively.