Superimpose Plot
![]()
Superimpose plot tool allows the users to visualize the behavior of the transient variables over time and how a particular design variable is affecting the transient behavior.
As shown below user needs to choose a parameter along with this user needs to specify fixed values of other parameters that have been used for the DOE runs. User also needs to select the output variable shown on the ordinate axis.
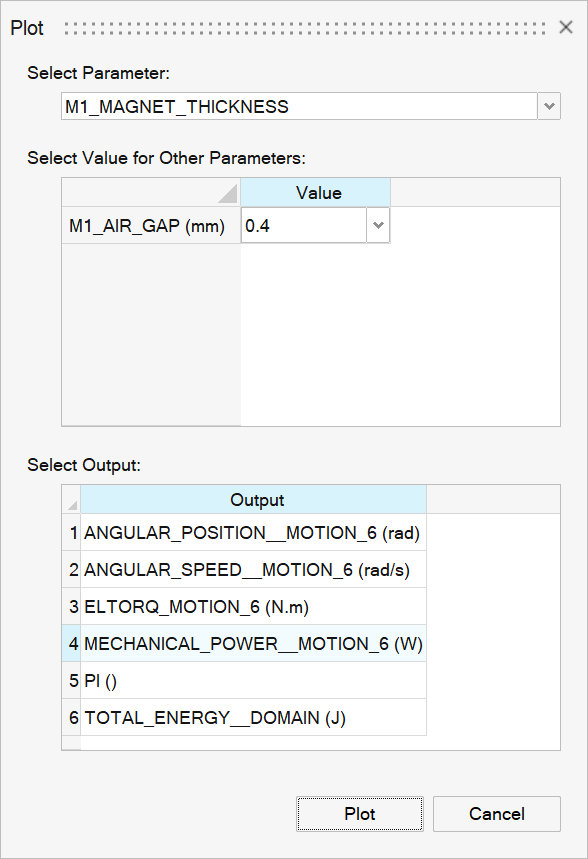
The abscissa is always the transient variable (Time, position, etc.) while the output quantity is shown in the ordinate axis. Different variations of the curves are plotted for each value of the chosen input parameter.
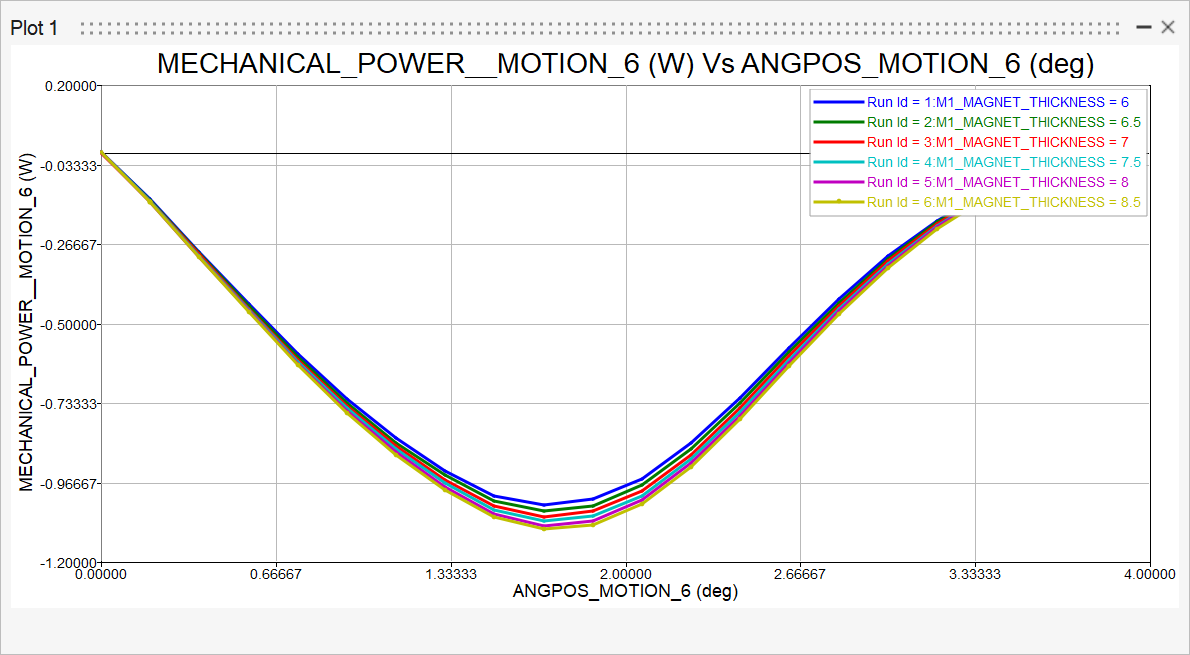
The superimpose plot tool can be considered as a more advanced version of the linear effects and the scatter plot tools. In the previous tools user can visualize only statistical data across the runs, while in this case user has access to the complete plots.