Scatter
![]()
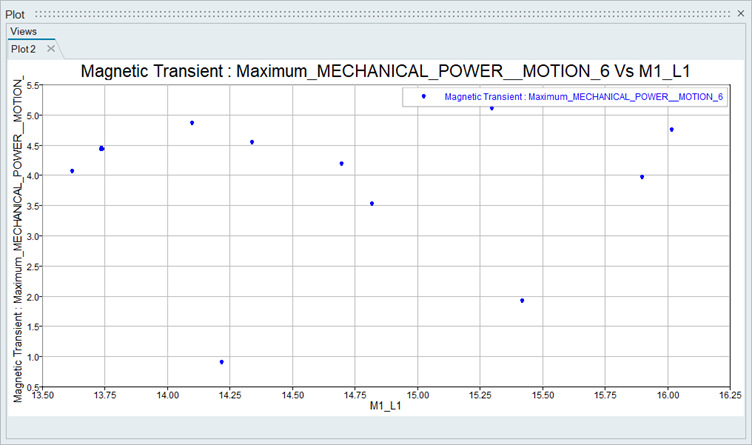
Scatter
Each point on the plot represents the value of the parameter and the value of the response for each experiment in DOE table. The scatter plot is used to explore the relationship between parameters and responses. If there is a positive relationship between the parameter and responses points will tend to form a pattern that slopes upwards from left to right. if there is a negative relationship between the parameter and the response, then the points will tend to form a pattern that slopes downwards from left to right. If there is no relationship between the parameter and the responses, then points will appear randomly scattered across the plot.