Linear Effects
![]()
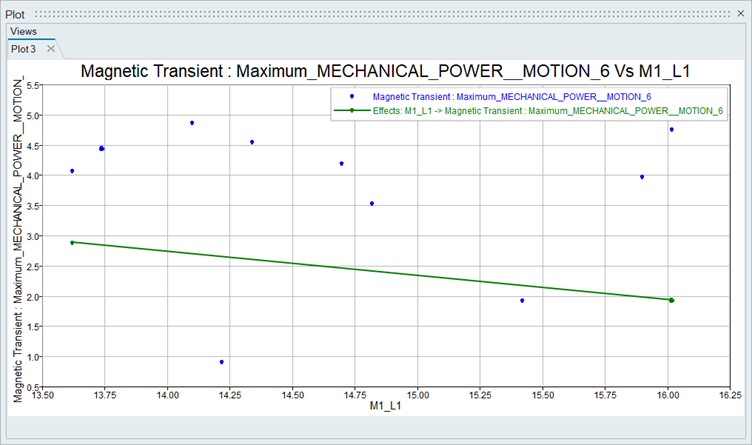
Linear Effects
A linear effects plot is a graphical representation used in DOE to show how changes in parameters affect a response variable. Plotting the effects of each parameter on the response variable helps to identify which parameter has a significant impact. The linear regression line is used to interpret the relationship between the parameter and the response variable.