Simulation and Analysis of the GranuDrum Granular Material Flow Analyzer test
This section provides instructions on running an EDEM simulation of the GranuDrum® Granular Material Flow Analyzer developed by GranuTools and computing the standard measurements of the instrument from the simulation data using the GranuDrum calibration kit.
Introduction
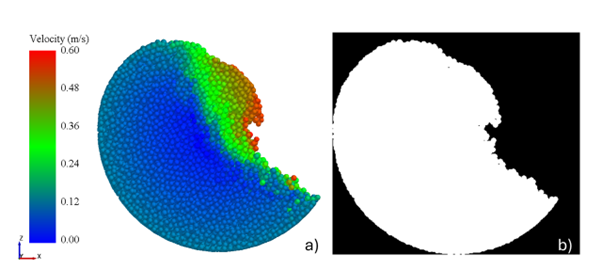
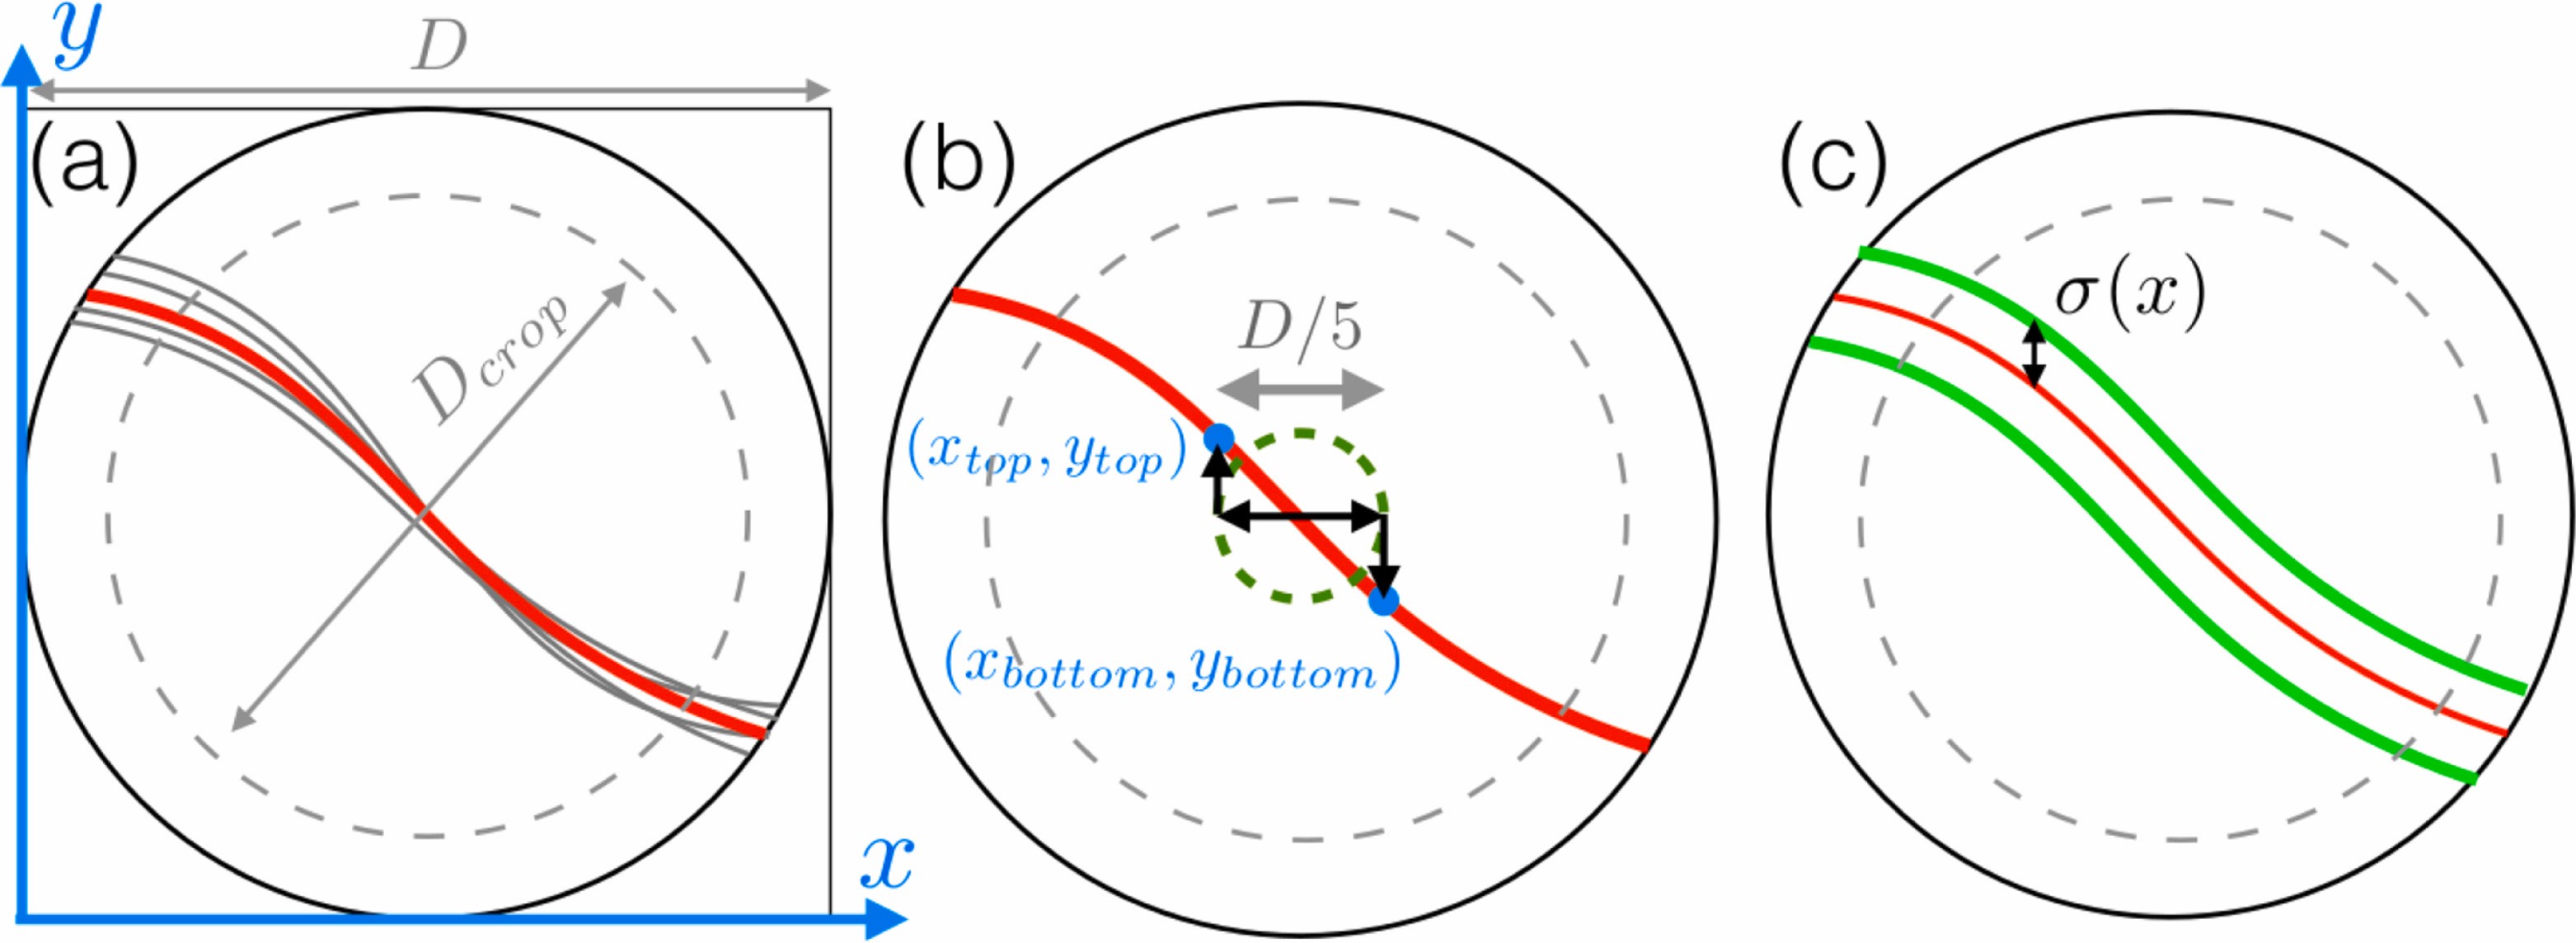
The GranuDrum® methodology is a standardized version of the well-known rotating drum powder flowability characterisation methodology whereby the flow behavior and cohesive properties of granular materials are characterized using the Dynamic Angle of Repose (DAoR) and Cohesive Index (CI) measurements. By carefully controlling the rotation speed and capturing high-resolution images of the powder's surface, GranuDrum provides precise and repeatable measurements of powder flowability.
- Automated Measurement - GranuDrum automates the rotation and data acquisition process, reducing human error and increasing measurement consistency.
- Data Analysis - GranuDrum processes the captured images to calculate the DAoR and CI without any human intervention.
- Consistency and Repeatability - By using standardized testing methodology, GranuDrum ensures that measurements are consistent and repeatable across different batches of powder, which is crucial for accurate and reliable results.
Prerequisites
All the requisite files are located at: <Altair installation folder>\EDEM <version>\examples\Calibration Kits\GranuDrum.
Using the kit
| Parameter | Description |
|---|---|
| Number of Images (-) | Specifies the number of images taken around the granular pile for the determination of the AoR and CI. The orientation angles are equally spaced between 0 and 180 degrees. The minimum value is 1. |
| Save images? (Yes/No) | Specifies whether the analysis images are retained. If you select Yes, the images are stored in a sub folder within the simulation deck folder. |
| Analysis start time (s) | Specifies the lower limit of the simulation time range for which simulation data is included in the analysis. It is recommended to perform this analysis after the system has reached steady state, and this value must be set accordingly. |
| Analysis end time (s) | Specifies the upper limit of the simulation time range for which simulation data is included in the analysis. |
| Analysis step factor (Int) | Specifies the frequency of saved EDEM Time Steps included in the analysis.
A value of n means every nth saved Time Step is
processed. Note: The image analysis
frequency is the inverse of the product of the analysis step
factor and the EDEM save
interval. The default image analysis frequency for GranuDrum
is 1Hz and it is recommended to maintain that frequency for
all cases. |
| Save images? (Yes/No) | Specifies whether the analysis images are retained. If you select Yes, the images are stored in a sub folder within the simulation deck folder. |
| Individual report? (Yes/No) | Specifies whether an individual results report is written out
for every simulation deck. If you select
Yes, a report containing all relevant
results is generated per simulation deck in its corresponding
folder in .csv format. |
| Summary report? (yes/no) | Specifies whether a summary report with the key results for
all simulation decks will be produced. The results are written
out in the Summary.csv file in the Python
script folder. |
The default values correspond to the standard test procedure of the instrument. A settings text file is required for each folder containing EDEM simulation decks, and the settings are used to post-process all simulation decks in that folder.
Acknowledgement
The development of the GranuDrum calibration kit was made during the PhD thesis of Ben Jenkins in the framework of a collaboration between GranuTools and the University of Birmingham under the academic supervision of Dr. Kit Windows-Yule and Prof. Jonathan Seville.