Usage by Vendor Features
This report presents various summary metrics segmented by vendors for a specified time period.
- Goal
- To evaluate feature usage across a given software in terms of number of users, checkouts, usage hours, and denials. With the addition of peak metrics (max, percentile, average) compared to available licenses, you can gain deeper insight into the utilization of licensed features. Additionally, review the Usage Efficiency report by right-clicking on any feature and selecting the drill path.
The report details are as follows:
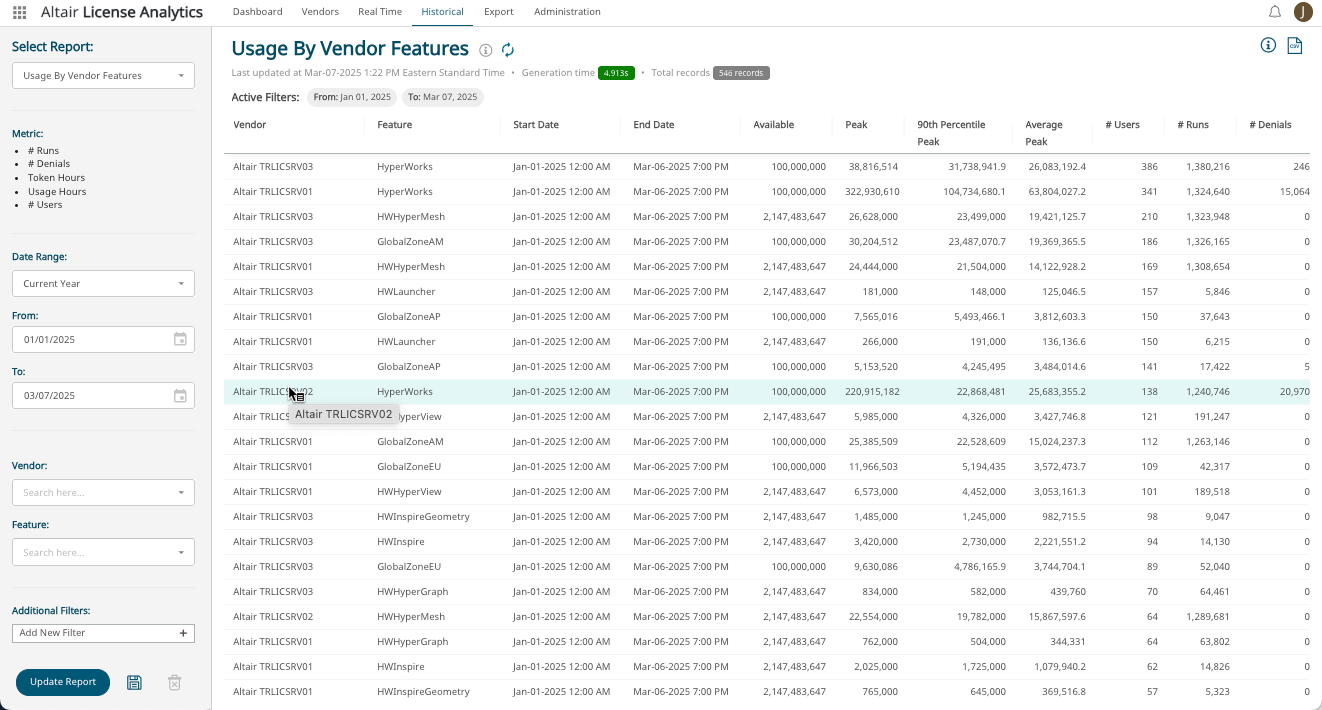
| Name | Description |
|---|---|
| Vendor | Software |
| Feature | Licensed Feature |
| Start Date | First checkout date |
| End Date | Last checkout date |
| Available | Number of available licenses |
| Peak | Max concurrent checkout license consumption |
| Percentile Peak | Specific percentile peak of the data distribution |
| Average Peak | Average peak |
| Num Users | Number of Distinct Users |
| Num Runs | Number of NORMAL and BORROWED records |
| Num Denials | Number of denials |
| Usage Hours | Total hours used |
| Token Hours | Total hours used in terms of token hours |
| Longest Run | Longest checkout duration |
| Shortest Run | Shortest checkout duration |
| Average Run | Average checkout duration |