Usage Efficiency
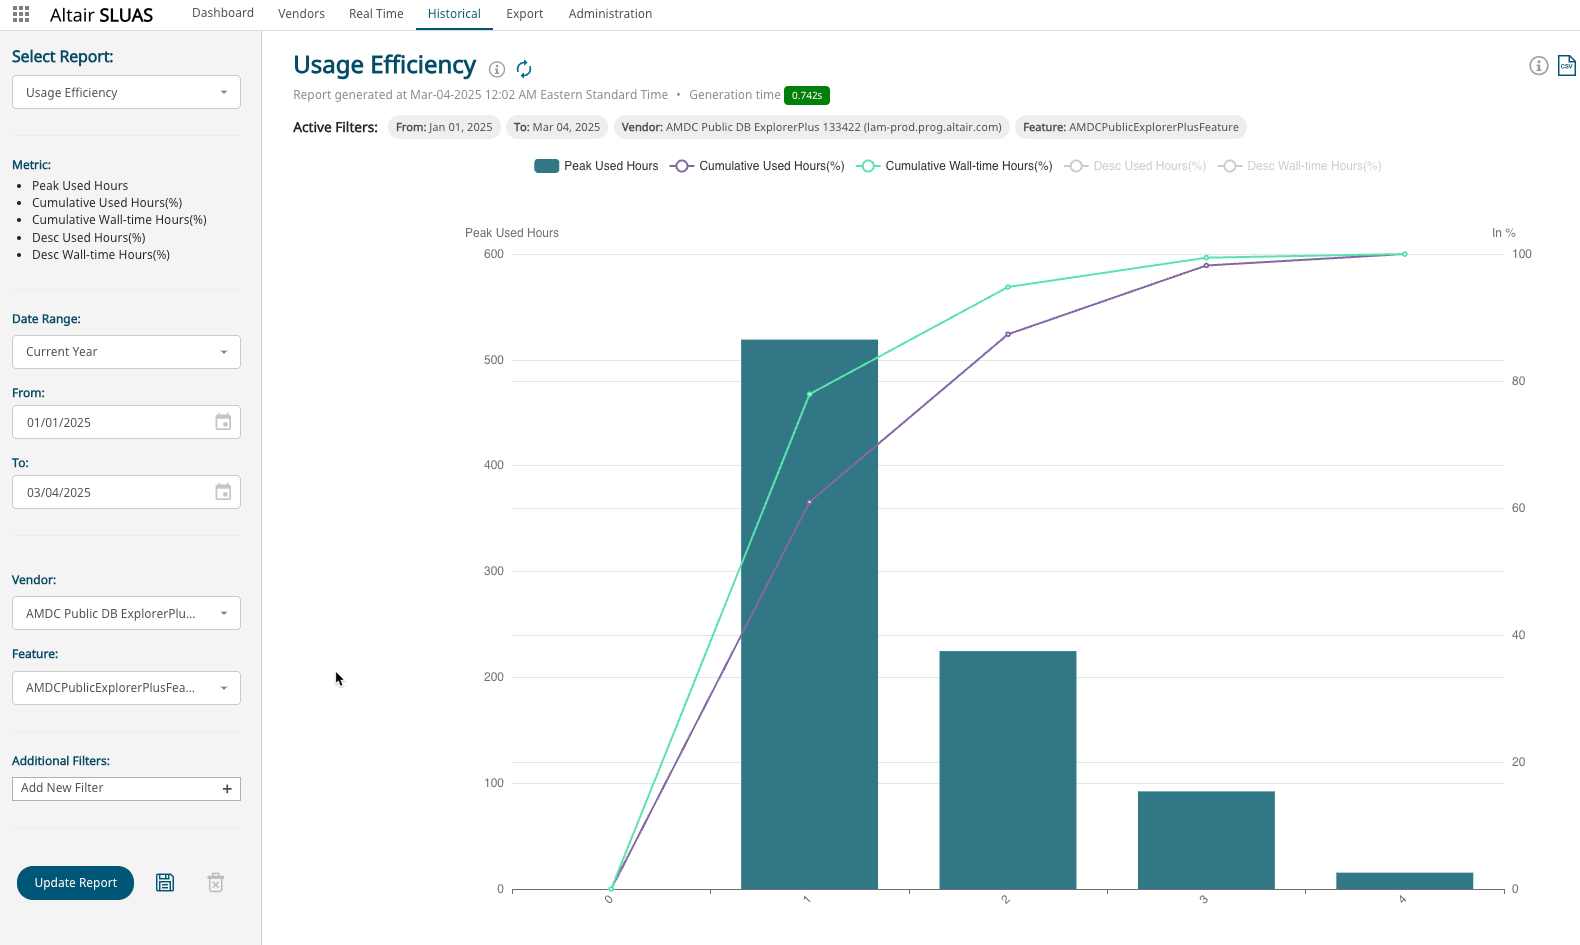
This report illustrates how efficiently software is utilized. By analyzing unique peaks and total hours used, we can identify the distribution of where peaks occur most frequently.
- Goal
- An efficiency chart—particularly one with cumulative ascending data—can help determine the appropriate software license level based on the most concentrated usage hours or wall time. Look for steep ascents in the cumulative line, which indicate periods of high license utilization.
The report details are as follows:
| Name | Description |
|---|---|
| Vendor | Software |
| Feature | Licensed feature |
| Peak Used Hours | Total hours for the observed Peak |
| Cumulative Used Hours % | Total hours the software is used over time (ascending as usage accumulates) in percent |
| Cumulative Wall time Hours % | Total wall time hours the software is used over time (ascending as usage accumulates) in percent |
| Desc Used Hours % | 100 - Cumulative Used Hours |
| Desc Wall time Hours % | 100 - Cumulative Wall time Hours |