Define Line Plots
Tutorial Level: Intermediate In this tutorial, you will learn how to create line plots from a file and create line plots using a math expression.


The Define panel enables you to edit existing curves and create new ones. New data can be selected from a source file, mathematically defined using the program's curve calculator, or entered as values. The options in the panel change depending on which source is selected. If the source chosen is Math, the panel looks as shown below:
The Curve list displays the names of all curves in the active window. Curves can be renamed, added, cut, copied, and pasted using the curve list controls.
Create a Line Plot from a File
- From the menu bar, select .
- From the Define panel, select Line from the drop-down menu.
-
Click Add under the Curve list.
A curve labeled Curve 1 is added to the list.
-
Rename Curve 1 to Line Curve 1 and press Enter.
The new name is now displayed in the list and in the legend.
- Under Vector, select X.
- Set the Source type as File.
- From the plotting folder, select the file nodout.
-
Ensure X is selected for the vector.
- For Type, select Time.
- For Request, select Time.
- For Component, select Time.
-
Under Vector, select Y. Then, make the following
selections:
- For Type, select Node Data.
- For Request, select Nodal Point 26742.
- For Component, select Resultant Displacement.
-
Under Vector, select Z. Then, make the following
selections:
- For Type, select Node Data.
- For Request, select Nodal Point 26742.
- For Component, select Resultant Displacement.
- Click Apply.
- Click Add under the curve list to add another curve.
- Repeat steps 4 through 10 choosing Nodal Point 26766 as the Y and Z Request and Resultant Displacement as the Component.
- (Optional) Plot for other Requests and Components.
Create a Line Plot from a Math Expression
-
Create a page using the page navigation tools in the upper right corner.
Figure 3. 
-
Click Add under the curve list.
A curve labeled Curve1 is added to the list.
-
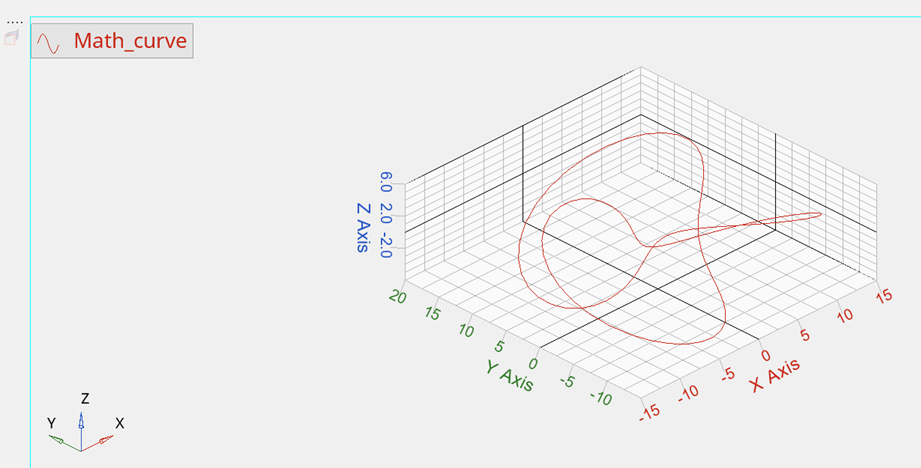
Rename the curve to Math_curve.
The new name is now displayed in the list and in the legend.
- For Source, select Math.
- Under Vector, click All.
- Set X to sin(2*u)*(10.0 + 6*cos(3*u)).
- Set Y to cos(2*u)*(10.0 + 6*cos(3*u)).
- Set Z to 6*sin(3*u).
-
Set U to 0:(2*PI):(PI/50).
Figure 4. 
- Click OK to close the dialog.
-
Click Apply to create the plot.
Figure 5. 