Plot Line Charts Using Results Data
Tutorial Level: Beginner In this tutorial, you will create and edit curves and plots.
Before you begin, copy the file(s) used in this tutorial to your
working directory.
Create a Plot with Multiple Curves
- From the Start menu, select
-
From the menu bar, verify that Line Chart is selected as
the current chart type
Tip: To change the chart type, click the Change Type icon (
 ) above the plot window and select Line
Chart.
) above the plot window and select Line
Chart. - Click to open the Create Curves by File dialog.
- From the Y Source tab, use the Choose Data Field file browser to open the file plot.dat.
- From the X Source tab, select Time.
-
From the Y Source tab, select the following:
- Type: Force
- Request: REQ/3 Curve 3, REQ/5 Curve 5, REQ/7 Curve 7, and REQ/9 Curve9
- Components: X
-
Click Plot and review the plot created.
Figure 1. 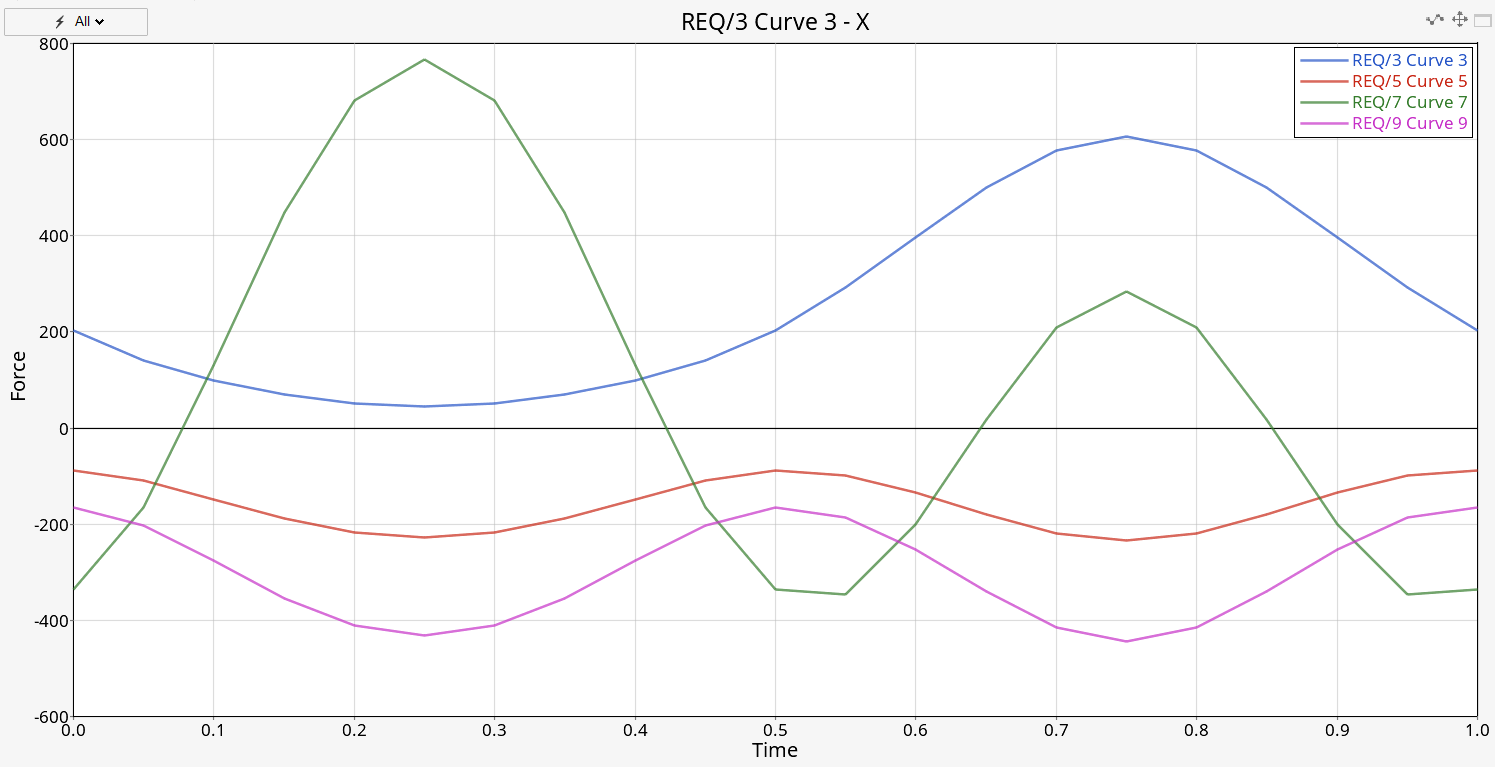
- Leave the Create Curves by File dialog open.
Create Multiple Plots
- From the Create Curves by File dialog, go to and select X, Y, and Z.
- From the Layout drop-down menu, select One Plot per Request.
-
Click the Set Page Layout icon,
 , and select the four window layout.
Figure 2. 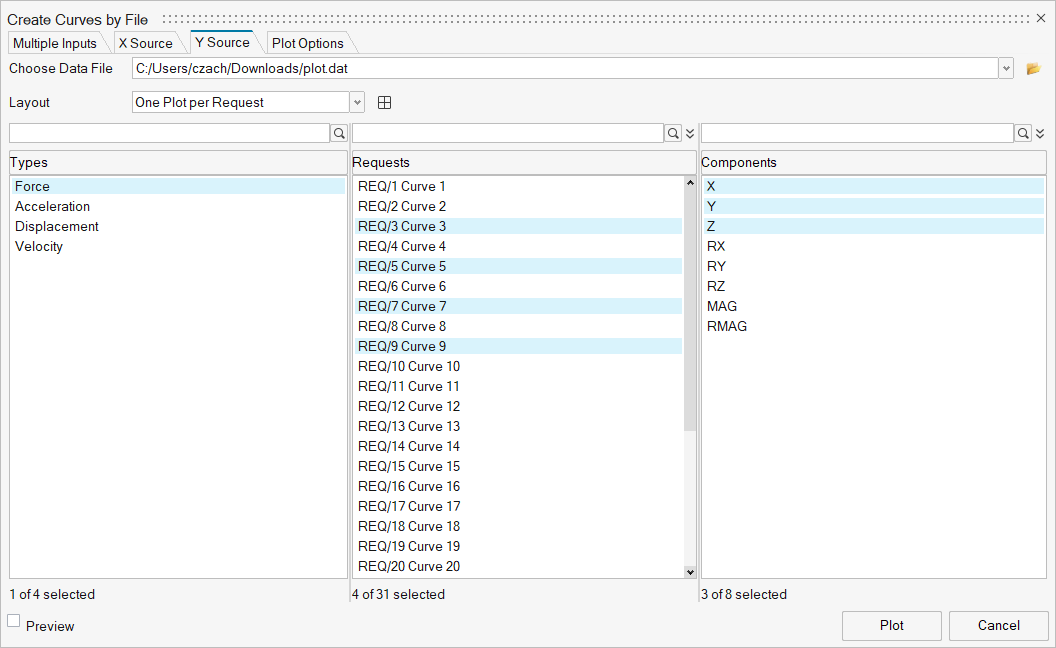
-
Click Plot.
Figure 3. 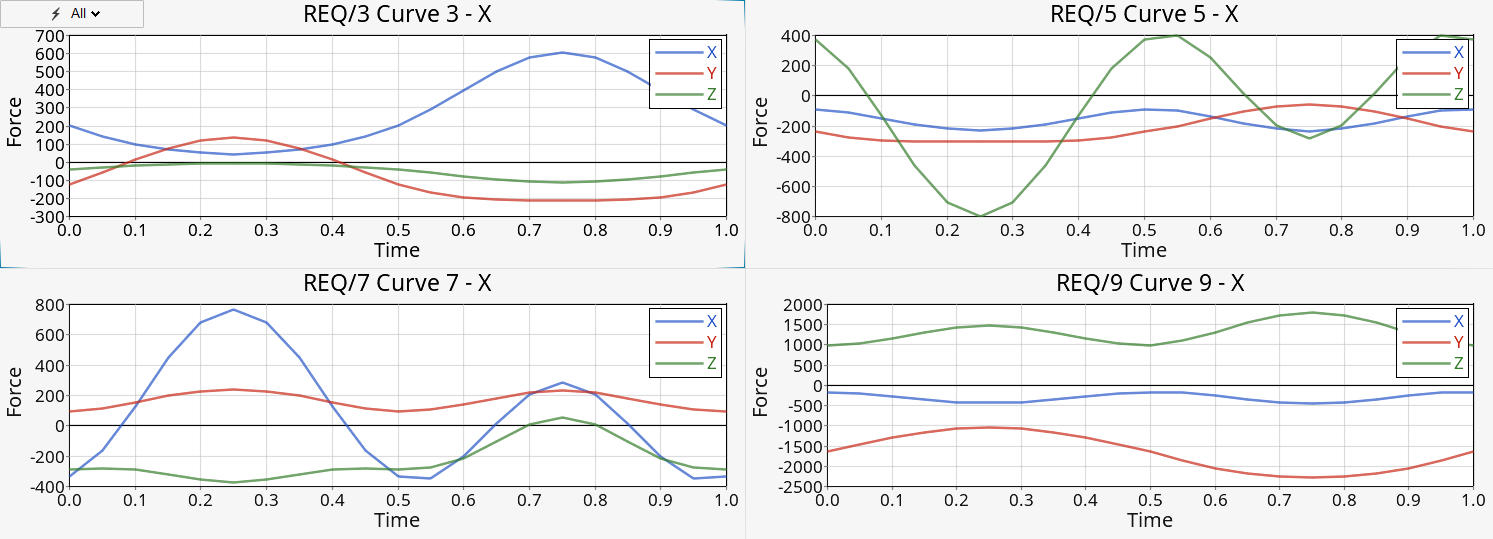
- Leave the dialog open.
Edit the Curves
- From the Create Curves by File dialog, select the Plot Options tab.
- Under Category, click Page Options.
- Click the Font field and select Arial, Bold, 16.
-
Click Header to define the following:
- Label Scheme: Custom.
- Header: Deselect the Y Component.
- Font: Arial, Normal, 12.
- Alignment: Center.
- Click Footer and set the same options as you did for Header.
-
Click Curve Options to define the following:
- Select Show Prefix.
- Label Prefix: Test17.
- Leave Show Label selected.
- Label Scheme: Default.
-
Click Plot to review these curves on page 3.
Figure 4. 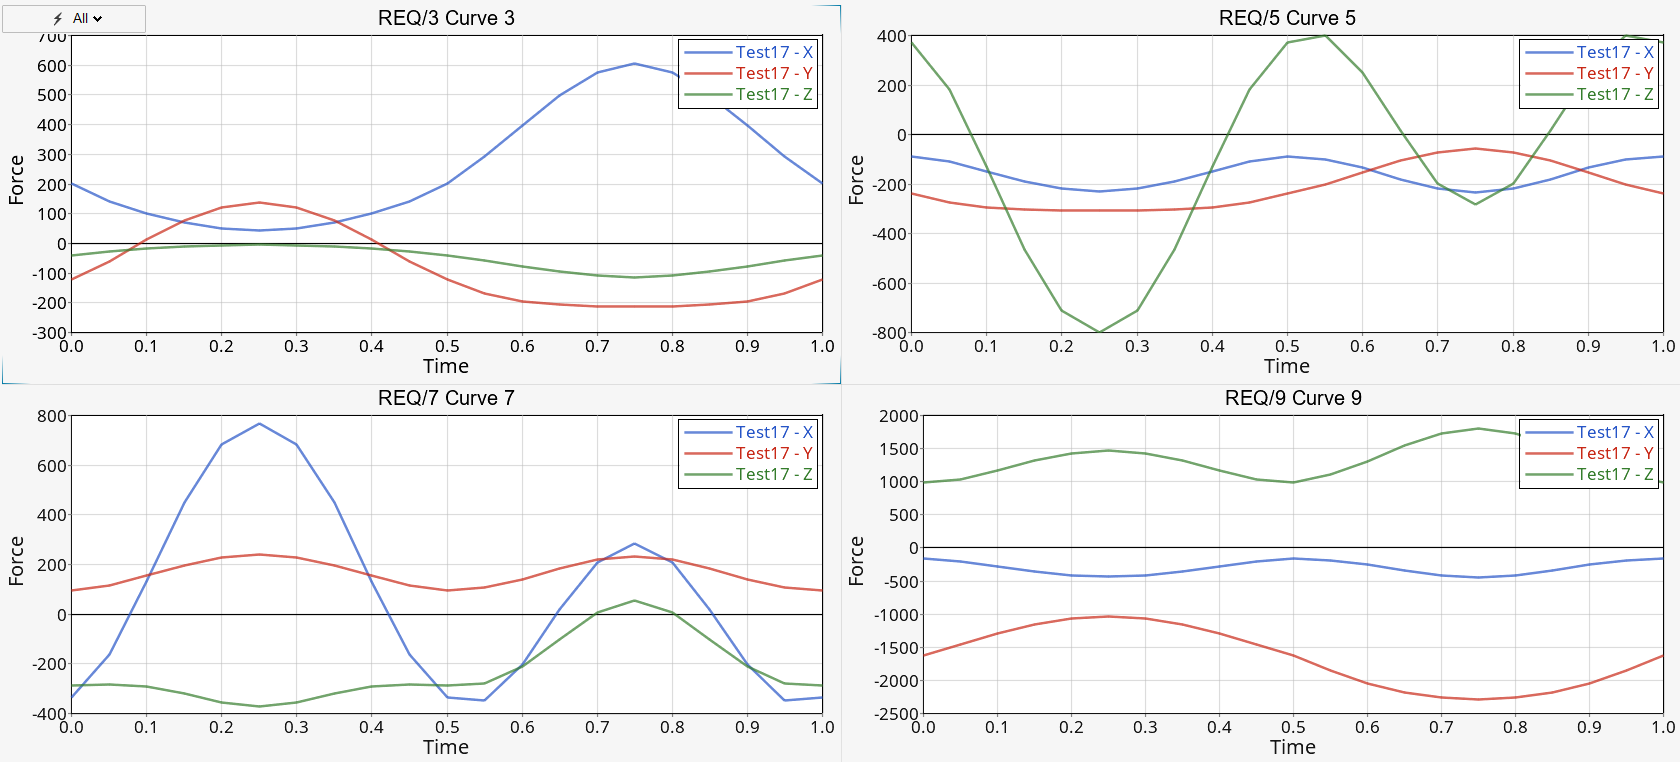
- Leave the dialog open.
-
Return to Curve Options to define the following:
- Select Math Expression.
- In the Expression for y field, enter the following: saefilt95(u,v,60,5,3)
Note: The syntax follows that of saefilt95:saefilt95(vector1, vector2, scalar1, scalar2, scalar3, scalar4).
- Click Plot.