Variability (Stochastics) Study
Study the effects of parameter variations on squeak and rattle issues.
The manufacturing of parts is often related to variations of tolerances and quality of materials. Also, the assembly process adds a set of variations on dimensions and connection of stiffnesses resulting in a unique product at the end of each build. These two major processes contribute to the quality and performance of the final product.
squeak and rattle are phenomena that are tightly related to the quality of the built parts, and performance can vary through the population of produced products.
- Prepare the FE model for analyzing squeak and rattle issues.
- Setup variability study for the following-
- Material Parameters
- Attachment Stiffness
- Thickness, and
- Damping
- Run analysis and post-process the results.
For this tutorial, you will use the solver deck exported from the Detailed Risk and Root Cause Analysis usecase. Once you import the Dynamic Loadcase solver deck, you can proceed with Variability (Stochastics) Study setup.
Variability Study Setup
In this step, you will setup variability study(s).
-
From Setup group, select Variability Study.
 Figure 1. A guide bar opens.
 -
From the guide bar, click
 to open the advanced selection option.
-
Select all the materials from the list.
The five materials in the model are selected. A microdialog opens.
 Figure 2.
 -
Select E from the list, and enter 20
in the
 and
and  value fields.
The parameter variation percentage for the study is defined.
value fields.
The parameter variation percentage for the study is defined.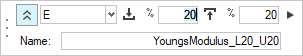 Figure 3. Tip: Click
 to expand the microdialog. You can define a desired name for the study or retain the
default.
to expand the microdialog. You can define a desired name for the study or retain the
default. -
Click
 .
The material Young's Modulus (E) variation study is created.
.
The material Young's Modulus (E) variation study is created. -
From the guide bar, click to open advanced selection option. Select all the
materials from the list.
-
Select RHO from the list, and enter
20 in the and value fields.
The parameter variation percentage for the study is defined.
-
Click .
The material Density (Rho) variation study is created.
-
From the guide bar, click to open the advanced selection option.
-
Click .
The Attachment Stiffness variation study is created.
-
Retain the default values in the microdialog and click .
The material Thickness variation study is created.
-
From the guide bar, click to open the advanced selection option.
-
Click .
The material Damping variation study is created.
-
Select Review Variations.
 Figure 4. A table opens containing all the variations and the related parameters.
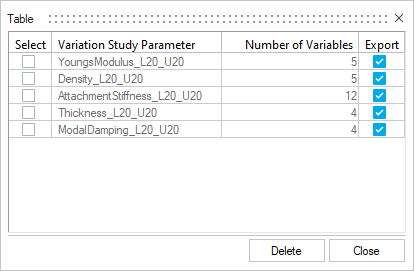 Figure 5.
Export Solver Deck
-
From Analyze group, click Export OptiStruct
Solver File.
 Figure 6. The Model Export dialog opens.
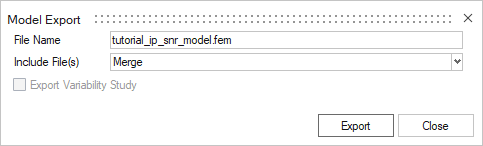 Figure 7.
 -
In the Model Export dialog, enable the Export
Variability Study checkbox.
The Variability Study properties are displayed.
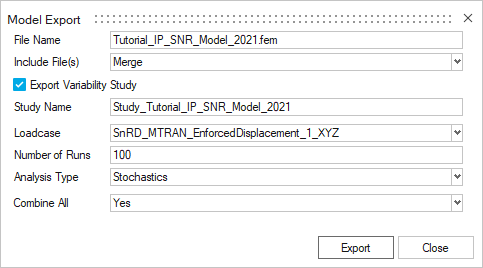 Figure 8.
Conduct Stochastics Runs
In this step, you will generate results database and summary files. These files will be later used in SnRD Post-processing.
- TPL
- XML
The template (TPL) file us created with the required parameters that are readable by HyperStudy.
-
Click Open.
A file browser option will be displayed. Browse and select tutorial XML file. Once the XML file is loaded, a session tree will populate in HyperStudy and the process will start from the Sto 1 node.
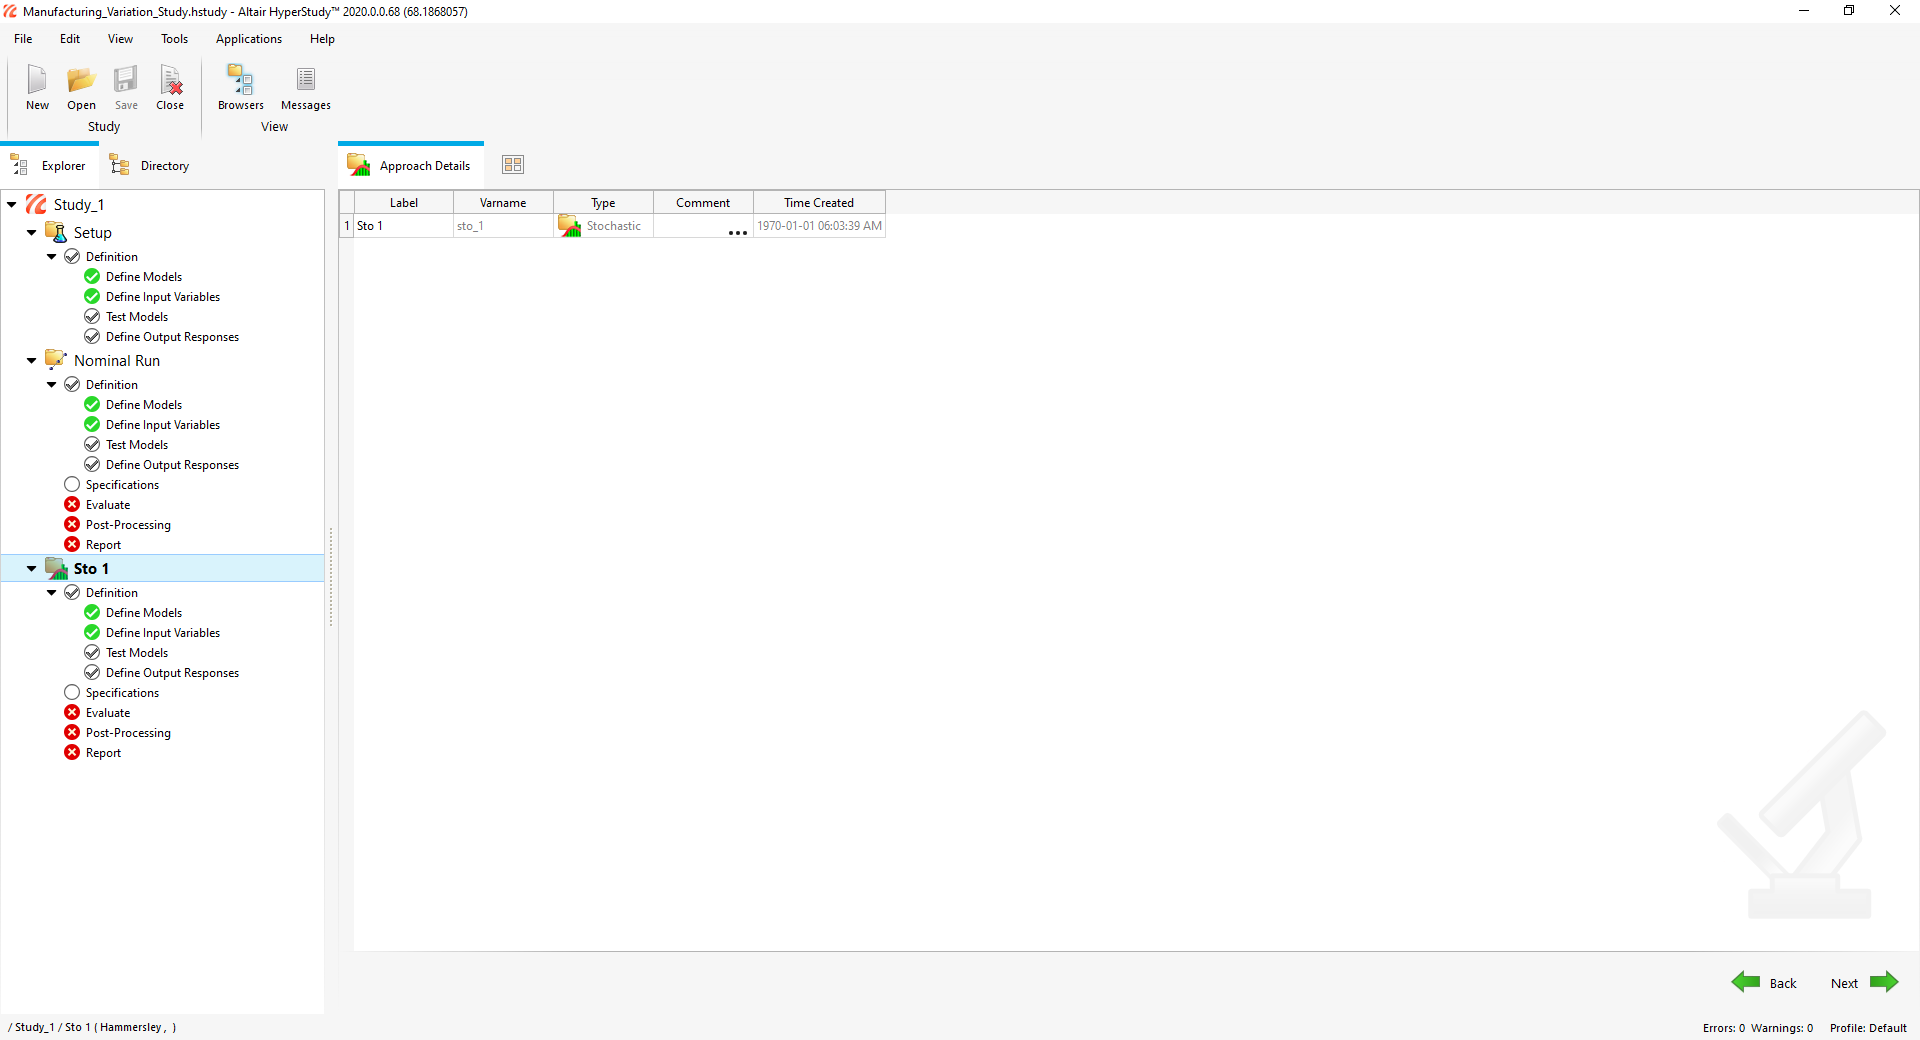 Figure 9. Note: Green checkboxes signify that the respective data is available. Any Yellow, Red, or empty boxes mean inputs are required.
 -
Click Next
 to proceed to the task.
Note: You can skip Define Models and Define Input Variables tasks since they are pre-defined.
to proceed to the task.
Note: You can skip Define Models and Define Input Variables tasks since they are pre-defined.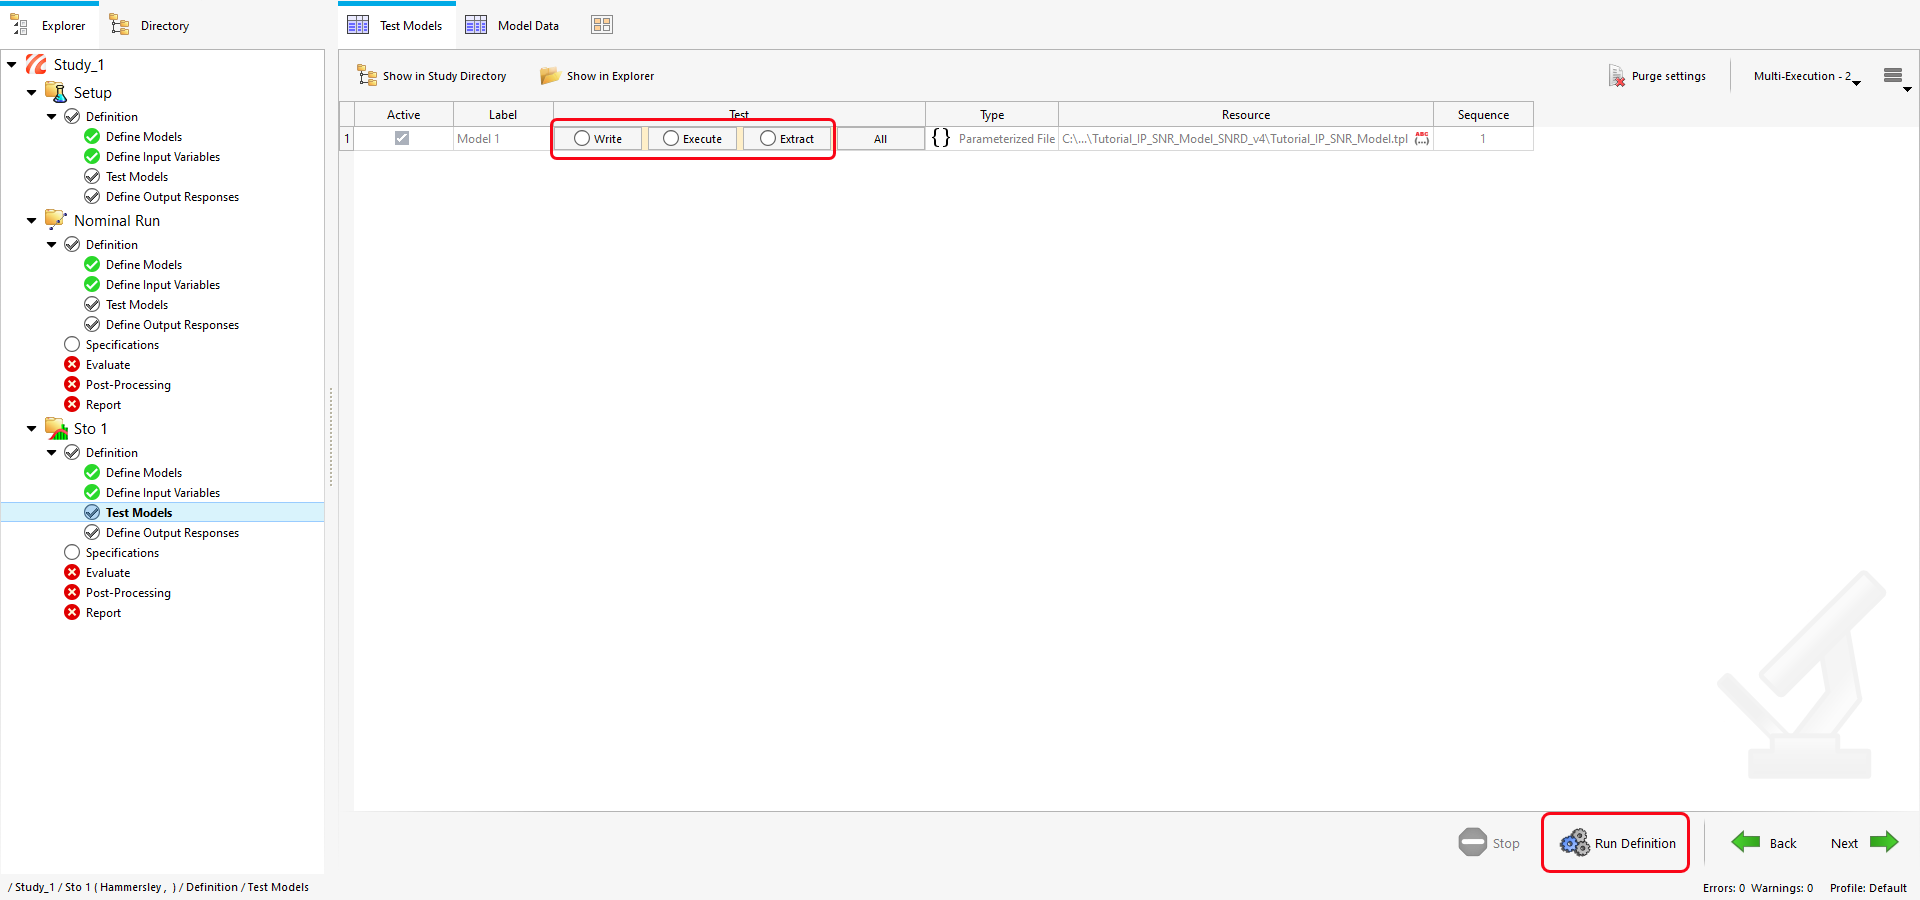 Figure 10.
 -
Click to proceed to Define Output Responses and click
Evaluate.
-
Click to proceed to Specifications
and click Apply.
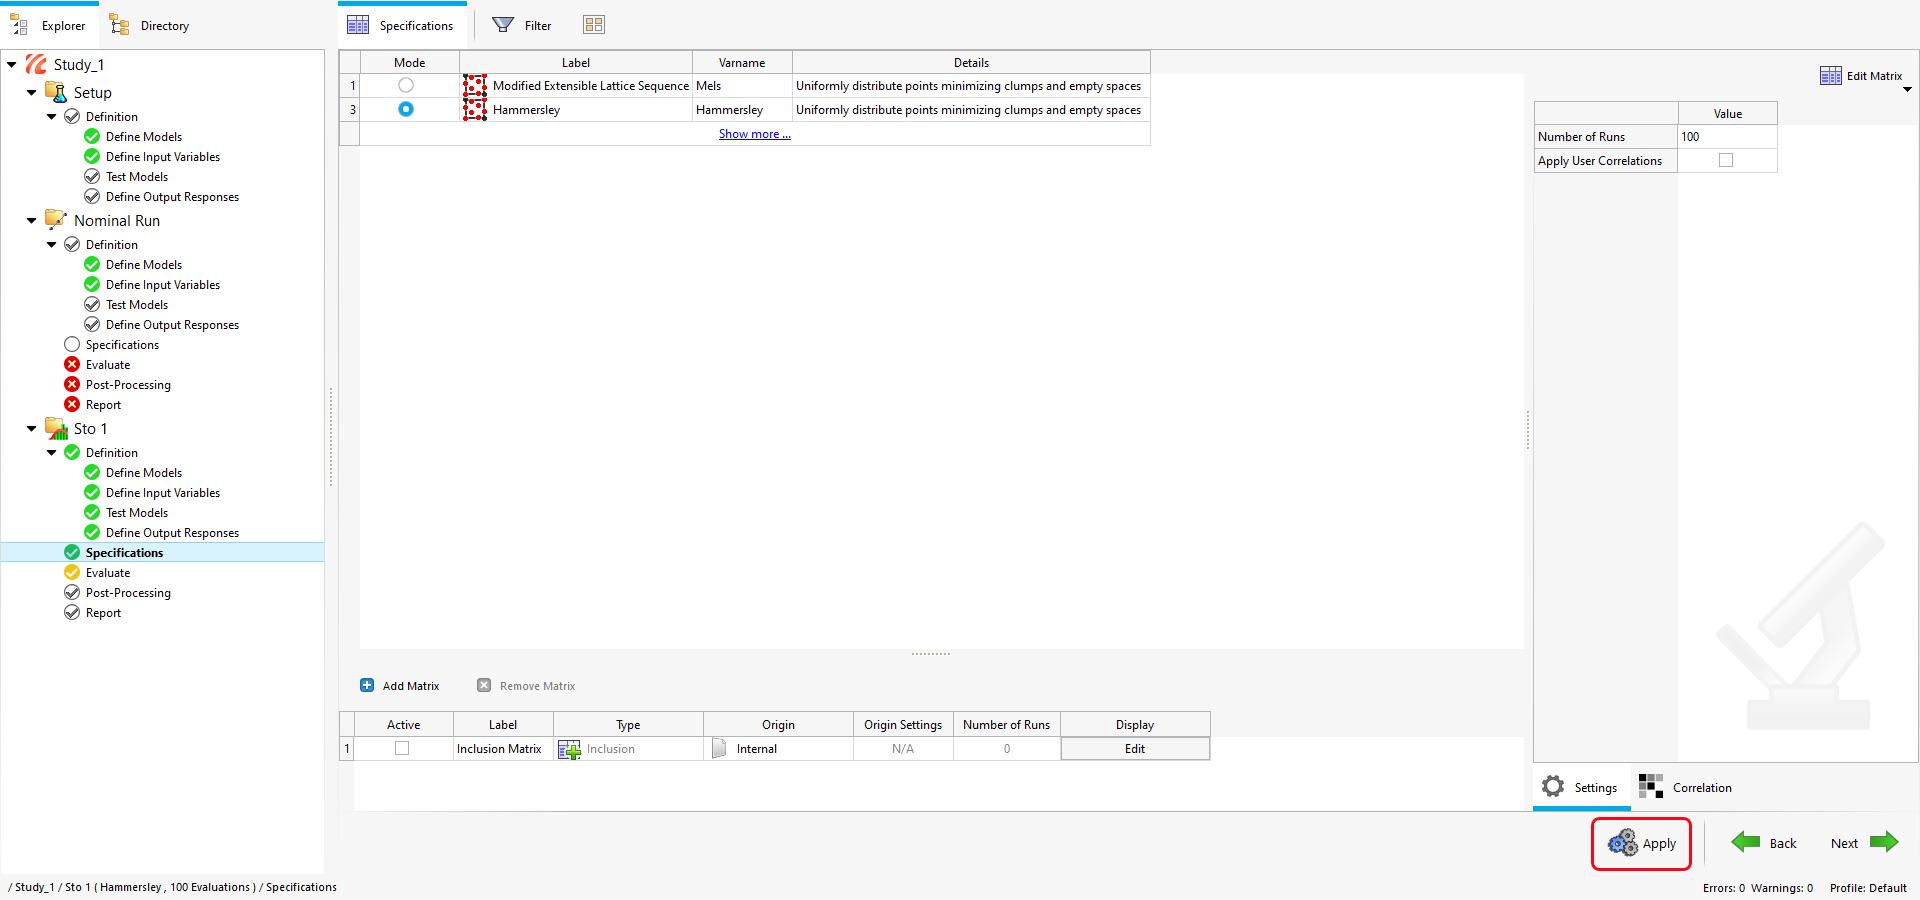 Figure 11.
 -
Click to proceed to Evaluate and
click Evaluate to run the stochastics variations.
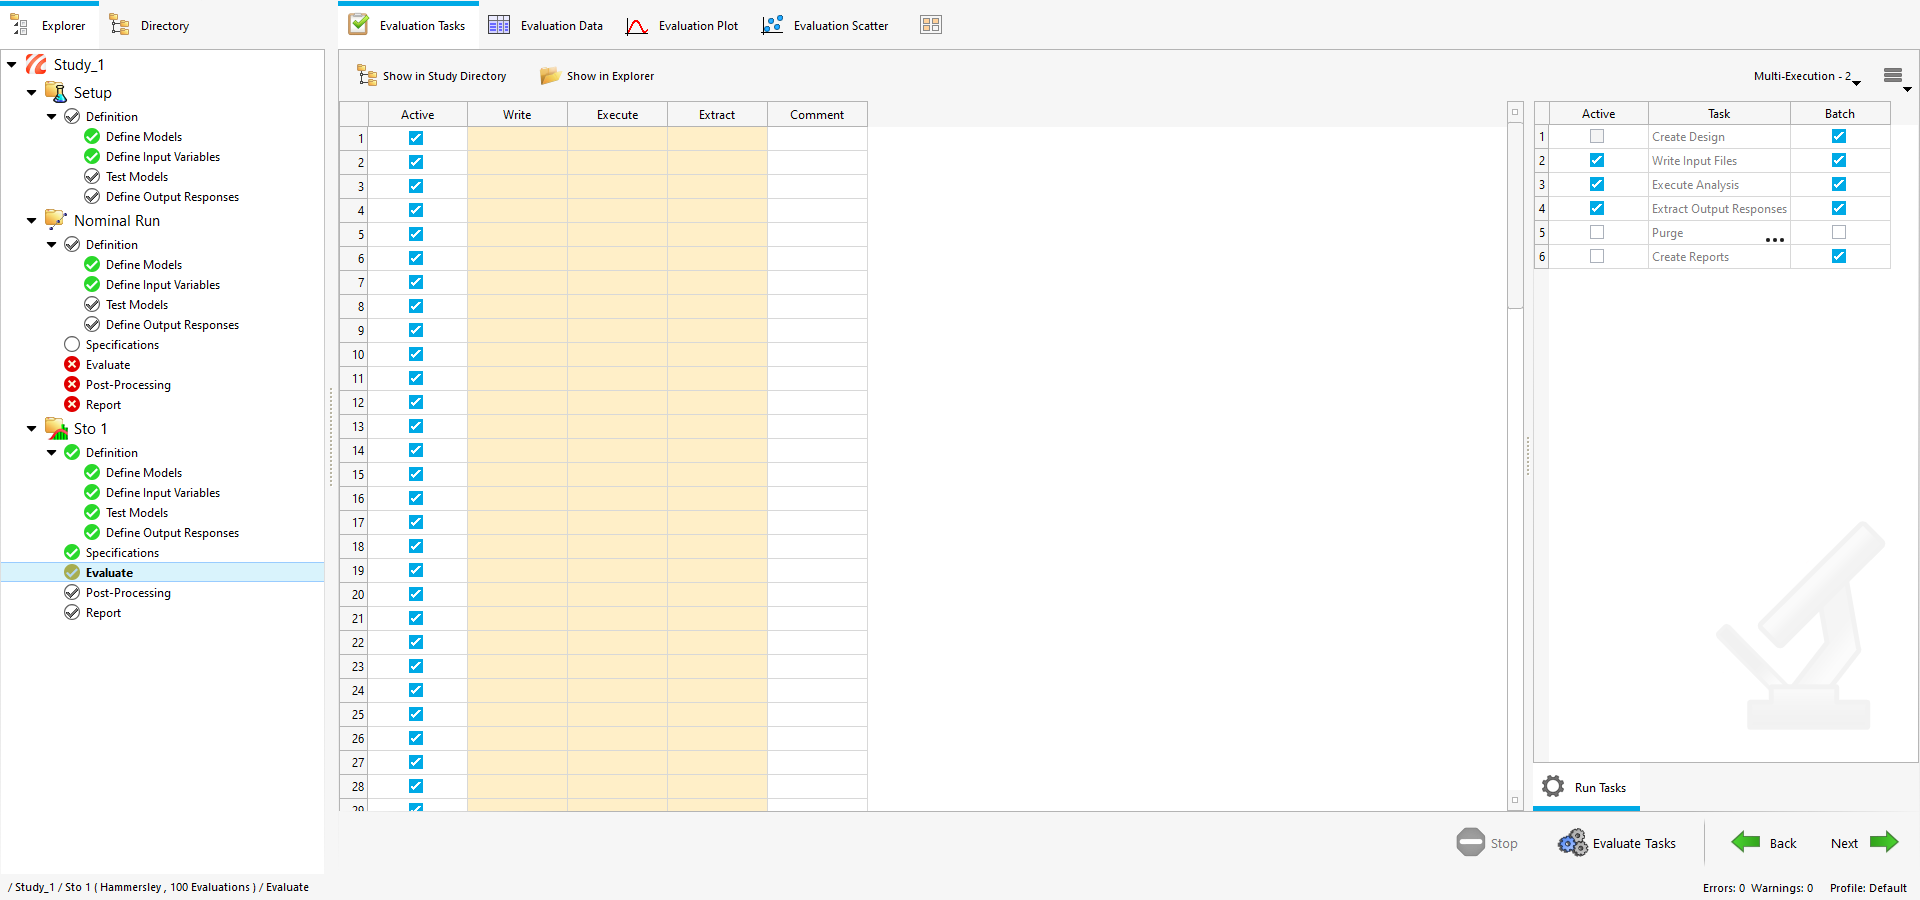 Figure 12. Note: Evaluation tasks will take considerable amount time to complete. Do not interfere with HyperStudy when the process is running.
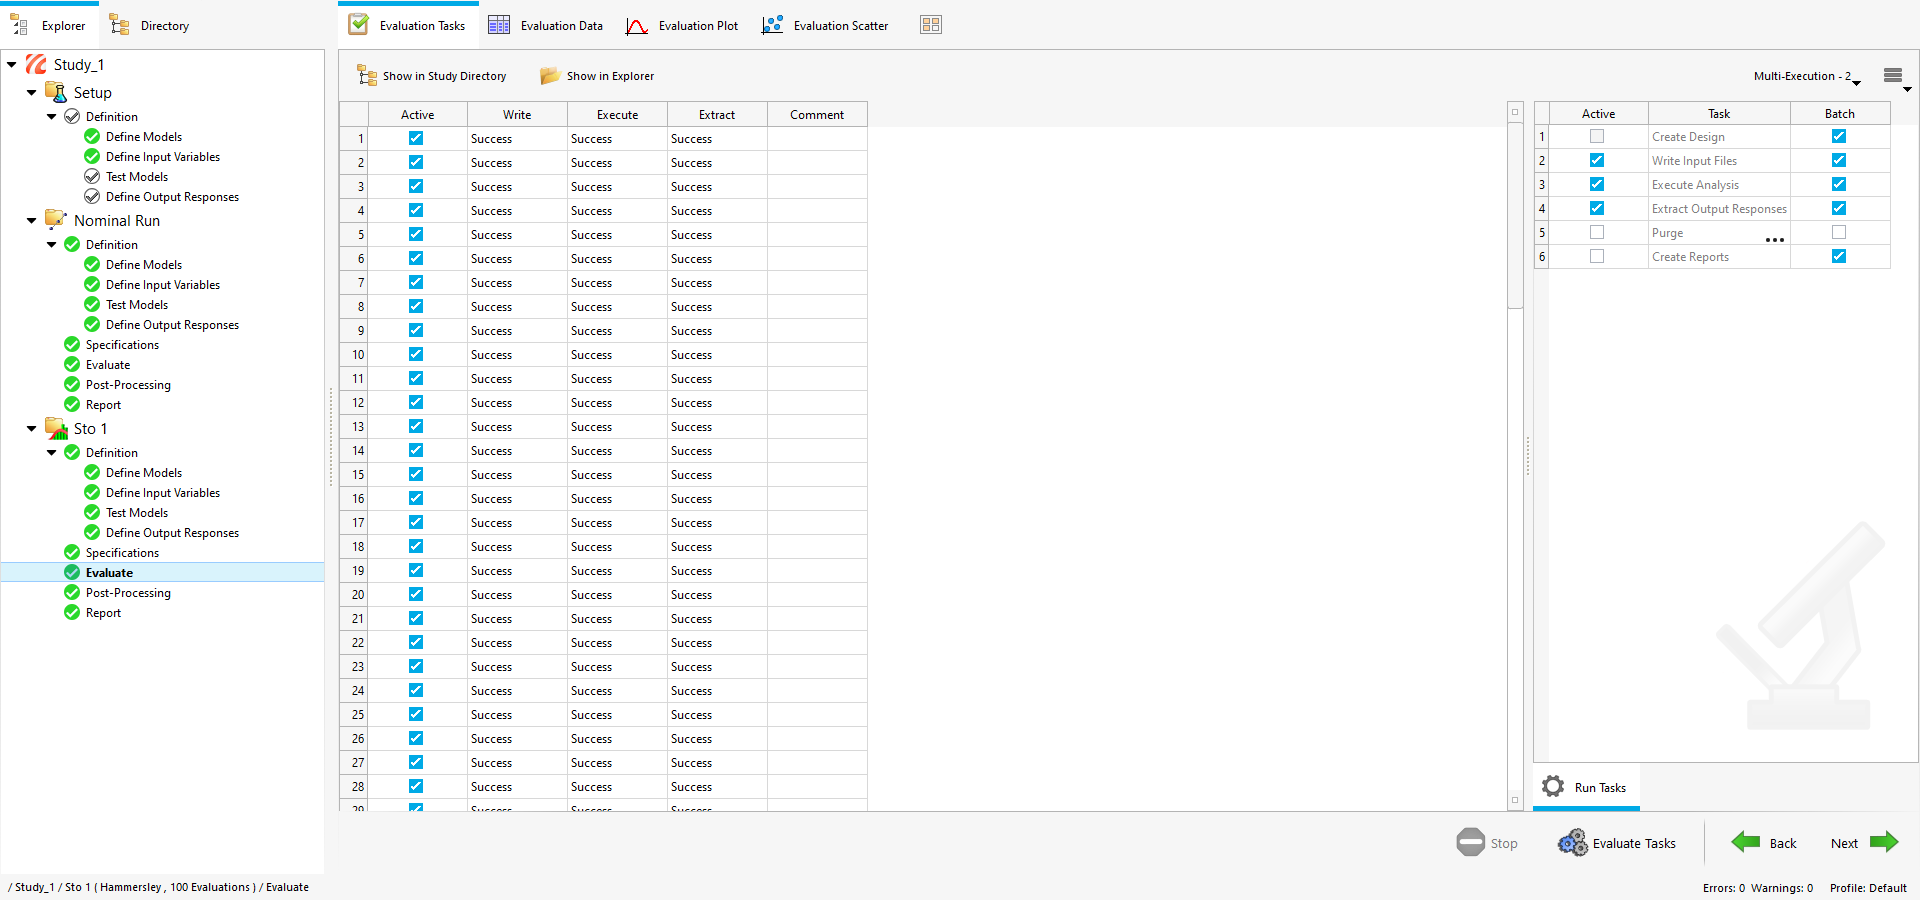 Figure 13. Once the evaluation is completed, remaining tasks, Post-processing and Report, turn green.
 -
Click twice to skip Post-processing
and navigate to the Report task.
Stochastics Post Processing
-
Click
 against HyperStudy Results Database.
A file browser window opens.
against HyperStudy Results Database.
A file browser window opens. -
Click Calculate.
Note: Since the number of runs is high and the process will take a considerable amount time, do not interfere with process.Once the calculation is complete, a confirmation message will be displayed.
 Figure 14.
 -
Click Apply Filters.
All the runs in the Run Selection table are filtered.
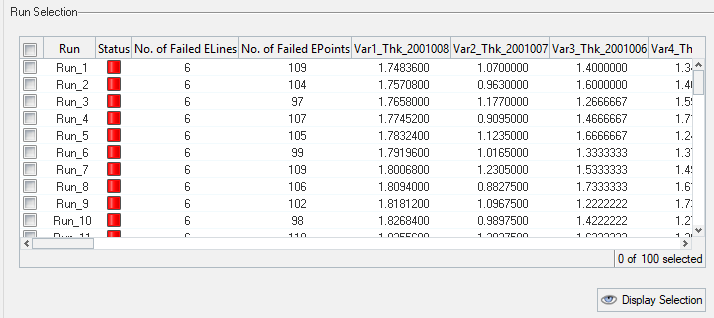 Figure 15.
 -
Click Display Selection.
The results for the selected runs are plotted.
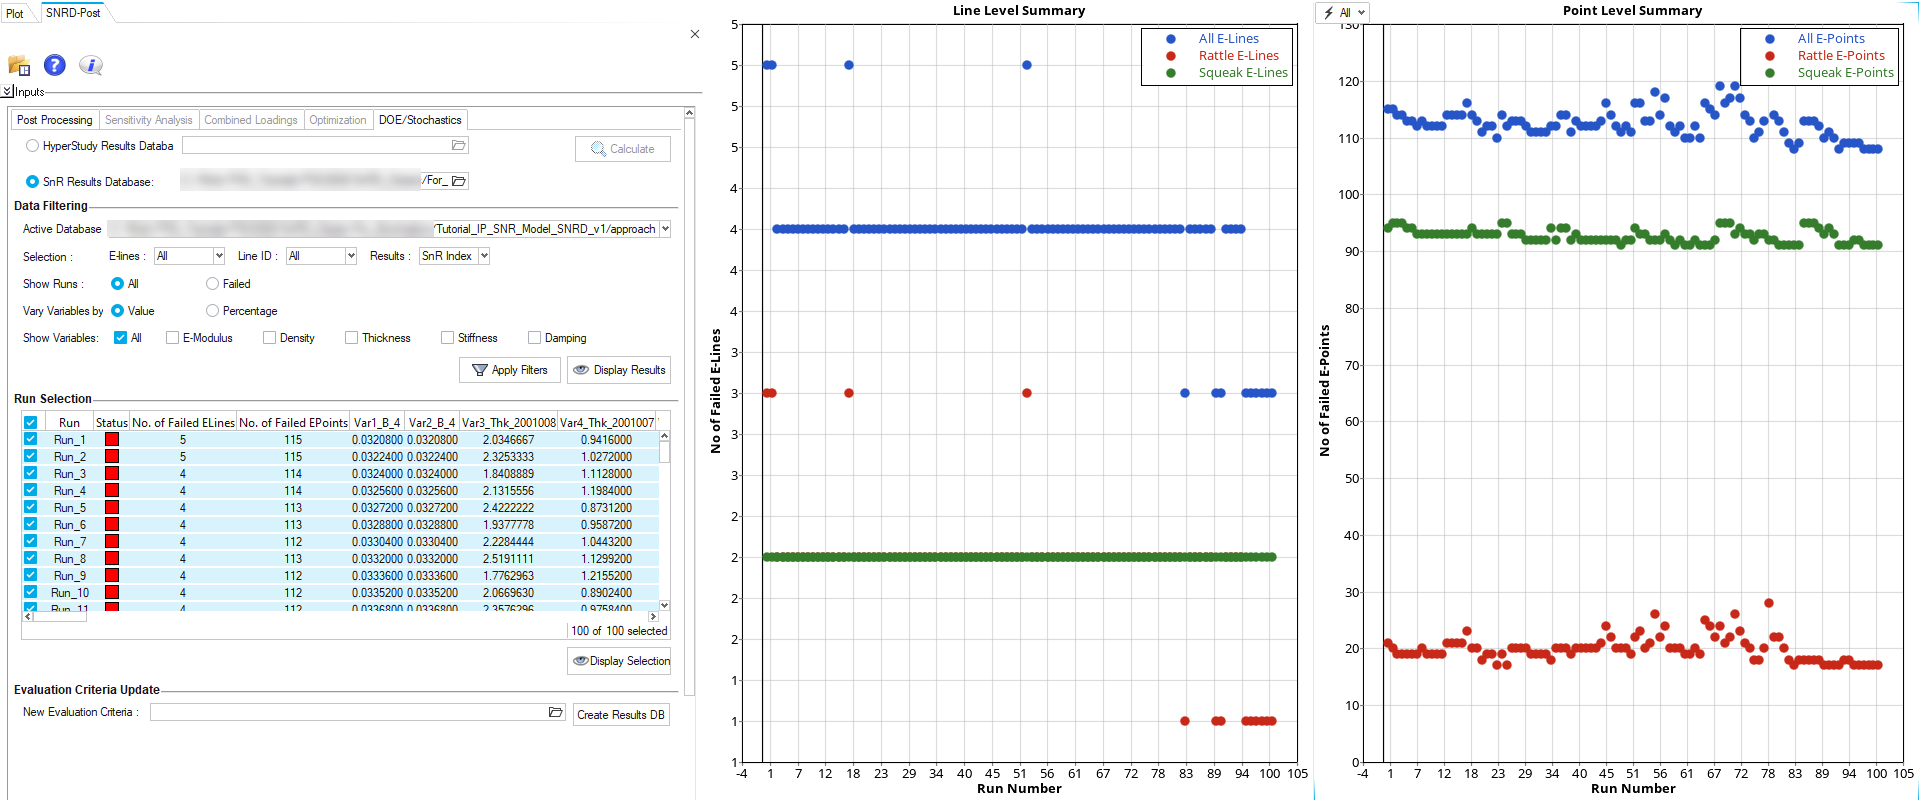 Figure 16.