
Create Plots from Intersection Curves
Use the Plots: Intersection Curves tool to render a 2D plot by extracting the intersection curve of a plane and a surface.
-
From the Post ribbon, click the tool.
Figure 1. 
- Select the surfaces or boundary groups that are to be intersected by the plane.
- Click Curve on the guide bar.
-
Select one of the three Cartesian planes in the modeling window to use as an intersection curve.
Figure 2. 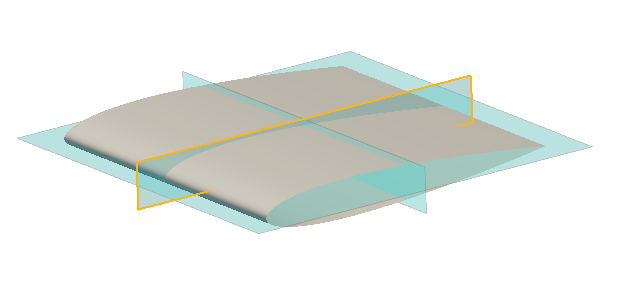
-
Reposition the intersection curve if needed.
- Drag the Move tool manipulators.
- Click X, Y, or Z to align to the global axes.
- Click
 to reposition with the Vector tool. Press Esc after moving.
- Click Intersect.
- Select the line segment to plot if multiple closed loops are detected.
- Click Seeds on the guide bar.
-
Enter the amount of points to consider.
Toggle Enable resampling to change the points on the curve from being evenly spaced along the intersection line to being at the intersection of the infinite plane and the edges that it intersects.
-
Select the first point to display in the plot. Click the point again to toggle
the direction the direction in which subsequent points are plotted.
Figure 3. 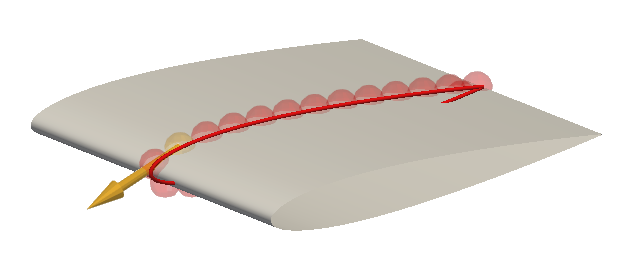
- Click Calculate.
-
In the plot dialog, select the x and y axis variables then click
 to define display properties.
Tip: Scroll to zoom in and out on the plot and right-click and drag to pan.
to define display properties.
Tip: Scroll to zoom in and out on the plot and right-click and drag to pan.Figure 4. 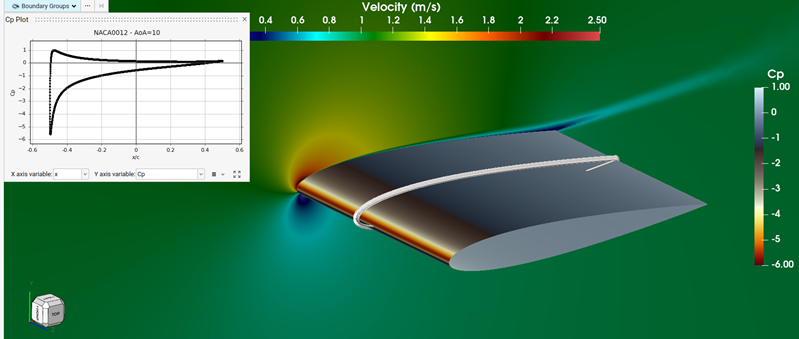
- Optional: Right-click on the plot definition in the Post Browser to export the data or an image of the plot.
-
On the guide bar, click one of the following:
 - Save changes and remain in the tool
 - Save changes and exit the tool
Tip: Click the plot entity icon in the Post Browser to toggle the visibility of both the intersection curve
and the plot dialog.