
Display Properties
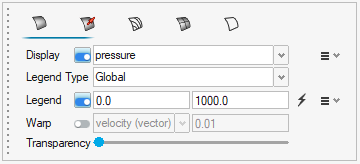
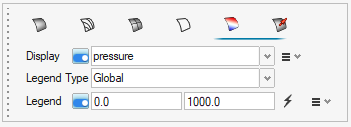
Use the options in the display properties microdialog to define post-processing visualizations.
| Option | Description |
|---|---|
| Surface/point display | You can either display surfaces, or the points of a
surface/part. Click 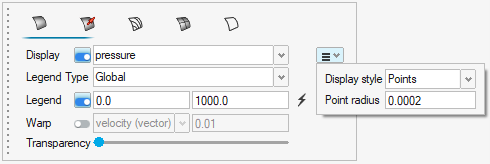 |
| Legend Type |
Legend Type allows selection of Global (default) or Local
Legend. When the user creates a derived representation with
a contour displayed for the first time for a given variable,
the legend will automatically be added to the scene and
stored for future use for the same variable. Subsequent
entities created using the same variable will automatically
inherit the colormap and other legend properties from the
initially created Global legend.
|
| Legend | Minimum and maximum range for the legend, controlled by the
toggle button to activate display. The |
| Warp |
Enable warping to displace the surface in a given direction
by a distance controlled by the scale factor and the chosen
warp variable. The warp direction is controlled by the
following logic:
In both cases, the distance to warp the surface is determined by multiplying the scale factor times the magnitude of the scalar/vector variable that was chosen. To reverse the direction of the warp, simply set the scale factor to a negative value. Boundary surface warping is particularly useful on inlets and outlets. When the surface is warped by the velocity vector, it creates a topographical view of the velocity field. This makes it very easy to see regions of higher velocity and lower velocity flow. This visualization technique can also take the place of a 2D line plot for visualizing a given flow profile. Warping on a slice plane is particularly useful for visualizing the wake velocity deficit behind a bluff body. Warping a surface by a scalar is also useful for visualizing the three-dimensional profile of the scalar field. In this case, the displacement direction is determined by the local surface normal. This can lead to confusion when toggling back and forth between the velocity vector (displaced in the direction of the vector field) and velocity_magnitude (scalar displaced in the direction of the surface normal). Also note that the scalars are warped according to their magnitude. Some scalars, such as absolute temperature, have a magnitude that is much higher than any local variation on the surface. In this situation, the surface will warp almost as a rigid body because the displacement is dominated by the magnitude. This can lead to the surface displacing completely off screen. |
| Vector display | Define how vectors on a given object are displayed. Define a vector scale factor and select a vector display based on magnitude or uniform value. You can also control the resolution of the vector tip and shaft. |
| Contour line display | Define how contour lines on a given object are displayed |
| Mesh line display | Define how mesh lines on a given object are displayed. |
| Feature line display | Define how feature lines on a given object are displayed. |
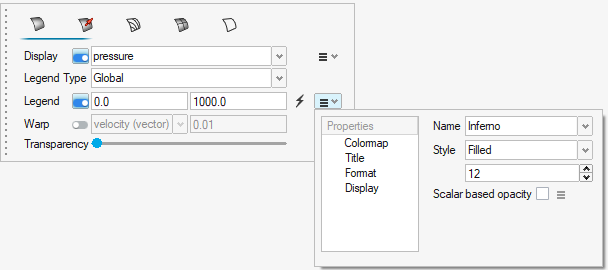
- Color maps and display style
- Opaque mapping for creating scalar-dependent transparency
- Title and text properties of the legend
- Position of the legend using the Move tool or pre-defined locations
| Option | Description |
|---|---|
| Scalar based opacity | The transparency of a visualization entity may be controlled
using scalar based opacity. Setting the transparency of a
boundary surface, slice plane, streamlines, or iso-surfaces may
help to enhance and give focus to the most important regions
within the flow field. Opaque mapping may set a high transparency value for the free stream velocity, which helps to provide focus to the regions of interest where the air tends to detach and recirculate in the wake bluff body. 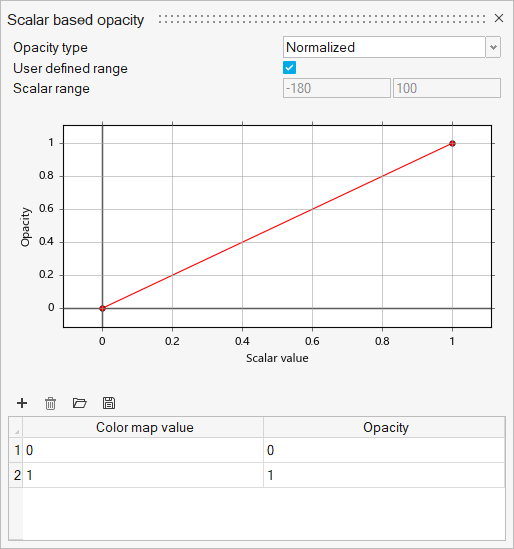 |
| Opacity type | Define the opacity type as the Normalized or Absolute value of the selected scalar. Normalized value defines the scalar color map value by dividing the scalar range by the minimum and maximum of that range to obtain a normalized value. |
| User defined range | Force the current entity to set the scalar range based on the legend properties defined in the previous dialog. Unselect if the scalar range should be taken from the local min/max of the current entity. |
| Scalar range | Non-editable field showing the range for the current entity or user defined range when active. |
| Color map value / Opacity | Define linearly dependent curve with control points to set the Opacity as a function of Color map value. |
| Option | Description |
|---|---|
| Volume properties | You can display the volume properties of a solid body by
resampling onto a Cartesian grid using a specified number of
sampling dimensions. Click 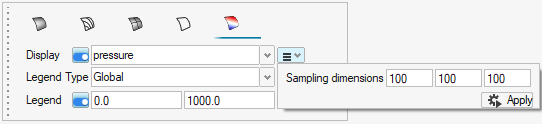 The sampling dimensions control the number of cells that the original data source is projected to for faster volume rendering. You may specify a non-uniform number of cells. Once the values are specified, click Apply to perform the resample calculation and display the volume results. Defining volume display properties is useful when interpreting the entire volume of a simulation where emphasis on a certain quantity is required. Utilizing scalar based opacity mapping is required for volume rendering. |
| Volume vector properties |
You can display the volume vectors within a solid body by setting a number of sample points, which will be evenly distributed within the selected volume. Click 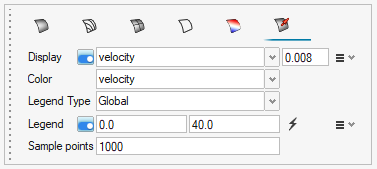
|
| Legend property: scalar based opacity | The transparency of the volume visualization entity may be controlled using scalar based opacity as outlined in the surface scalar-based opacity section. |