
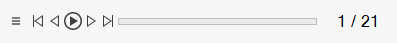
Transient Animation Toolbar
Control the animation of transient results while post-processing.
The Animation toolbar is located at the bottom of the modeling window.
- Rewind
- Click
 to rewind the
animation to the beginning of the sequence.
to rewind the
animation to the beginning of the sequence. - Click
 to rewind the
animation in increments.
to rewind the
animation in increments. - Play
- Click
 to start the
animation.
to start the
animation. - Pause
- Click
 to pause the
animation.
to pause the
animation. - Fast Forward
- Click
 to forward the
animation to the end of the sequence.
to forward the
animation to the end of the sequence. - Click
 to forward the
animation in increments.
to forward the
animation in increments. - Select a Frame
-
- Left-click on a point in the animation sequence or drag the
slider.The corresponding frame/time [frequency] displays above your cursor.
Figure 2. 
- Click the current frame/time [frequency] or enter a new value,
then press Enter.
Figure 3. 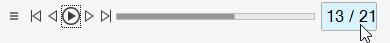
- The time value may be selected according to the physical time of
the results.
Figure 4. 
- The frequency value may be selected according to the frequency
associated with the results.
Figure 5. 
- Left-click on a point in the animation sequence or drag the
slider.
- Subset Temporal Range
- Click and drag
 or
or  to specify the start or end frame to reduce
the animation range. The control points modify the range of temporal
frames that are animated when the Play button is selected.
to specify the start or end frame to reduce
the animation range. The control points modify the range of temporal
frames that are animated when the Play button is selected.
Click ![]() to define the following options:
to define the following options:
- Animate all datasets
-
When this option is on, all datasets move in time [frequency] together. When this option is off, only the active dataset moves in time [frequency] when you interact with the toolbar.
Note that if multiple datasets are loaded where Time is present along with another where Frequency is present, the Animate all datasets option will not be modifiable, and each dataset must be animated independently.
- Playback display
- When this is set to Frame number, the toolbar shows the total number of frames present in the dataset. Note that the frame number does not correspond to the output step of the simulation, but rather an index in the array containing the output steps. When the playback display is set to Time/Frequency, then the toolbar shows the simulation time or frequency values corresponding to each step in the available dataset.
- Increment by
- Option to skip the user specified number of frames with the seek or play options. The default value is set to 1, allowing each frame to be selected when seek or play options are used. When the value is increased, the specified number of frames will be skipped when seek or play options are used.
- Reset range markers

- When selected, the range markers will snap to their original position, according to the data that is available for the active dataset.
The following is relevant for notes (annotations) that deal with simulation time and frequency.
When loading steady state simulation results from AcuSolve with multiple time steps of output available on disk, the time step is used in place of the actual time. For example, if the simulation output time is 50.0 e10, the time annotation and time value in the animation toolbar shows a value of 50.
"Time" or "Frequency" is a global quantity in HyperMesh CFD Post. There are no concerns associated with this when only a single dataset is loaded. However, it does have some implications when working with multiple datasets.
When working with multiple datasets, the following use cases arise:
- Multiple datasets, synchronous output, all being advanced in time together
- The time annotation always shows the proper time regardless of what dataset is active when the annotation is created.
- Multiple datasets, synchronous output, some datasets frozen in time
- The time annotation shows the proper time value for whatever dataset is active when it is created. In the case of a frozen dataset and an animating dataset, there can be two different times displayed simultaneously if different annotations are created.
- Multiple datasets, asynchronous output, all being advanced in time together
- In the case of asynchronous outputs that are being swept in time together, the list of output times from each dataset is merged into a single list. The animation then plays through each time value in sequence. If a given time value is not present in one of the datasets, that dataset snaps to the nearest time value in its own output record. This can lead to a situation where only one of the multiple animating datasets advances in a given frame. However, a time annotation from any dataset at this point will reflect the global value of time and may be out of sync with the actual value of time for the dataset if the global time was not present in the dataset's output time array. The annotation toolbar will reflect the global value of time in this situation.
- Multiple datasets, asynchronous output, some datasets frozen in time
- In the case of asynchronous outputs that are being swept in time together, the list of output times from each dataset is merged into a single list. The animation then plays through each time value in sequence. If a given time value is not present in one of the datasets, that dataset snaps to the nearest time value in its own output record. This can lead to a situation where only one of the multiple animating datasets advances in a given frame. However, a time annotation from any dataset at this point will reflect the global value of time and may be out of sync with the actual value of time for the dataset if the global time was not present in the dataset's output time array. In the case of a frozen dataset and an animating dataset, there can be two different times displayed simultaneously if different annotations were created. The frozen dataset's annotation will reflect the value of time at the frozen value. The annotation toolbar will reflect the global value of time in this situation.