Motor - Efficiency Map Scalar Control (U-f)
Positioning and objective
The aim of the test “Performance mapping – Sine wave – Motor – Efficiency map scalar” is to characterize the behavior of the machine in the "Torque-Speed" area.
Input parameters like, “the maximum Line-Line voltage, the rated power supply frequency, the maximum line current and the maximum speed” of the machine are considered.
One type of command mode is available: scalar command.
Input parameters define the torque-speed area in which the evaluation of the machine behavior is performed.
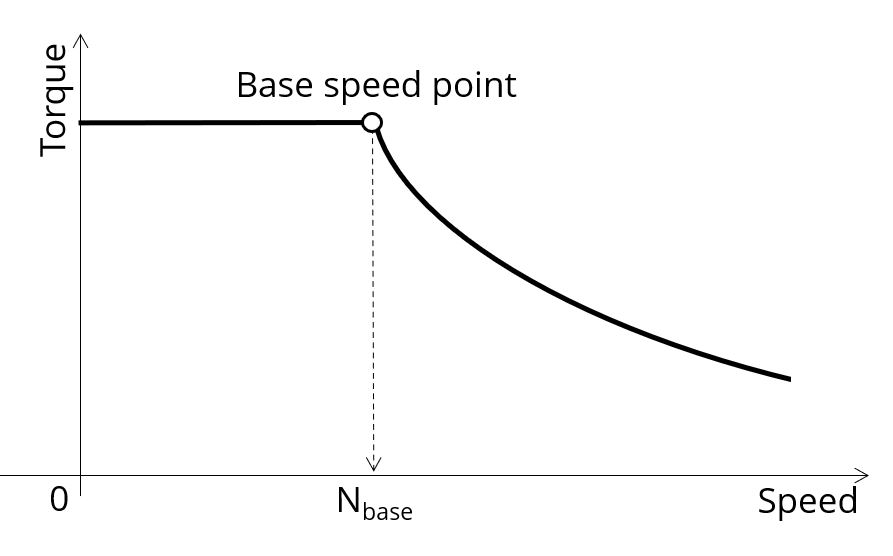 |
In the results, the performance of the machine at the base point (base speed point) and at the maximum speed (maximum speed point), set by the user are presented.
A set of curves (like Torque-Speed curve) and maps (like Efficiency map) are computed and displayed.
 |
 |
 |
 |
 |
| Family | Performance mapping |
| Package | Sine wave |
| Convention | Motor |
| Test | Effciency map scalar U-f |
| Positioning of the test “Performance mapping - Sine wave - Motor - Efficiency map scalar U-f” | |
User inputs
The four main user input parameters are “the maximum Line-Line voltage, the rated power supply frequency, the maximum line current and the maximum speed”. In addition, temperatures of winding, and squirrel cage must be set, and the power electronics data if needed.
Main outputs - Results
- Machine performance - Base speed point
- General data like torque, speed, electrical powers, power factor, efficiency etc.
- Power balance
- Machine performance - Maximum speed
- General data like torque, speed, electrical powers, power factor, efficiency etc.
- Power balance
- Torque-speed curves
- Mechanical torque versus speed
- Efficiency torque versus speed
- Current versus speed
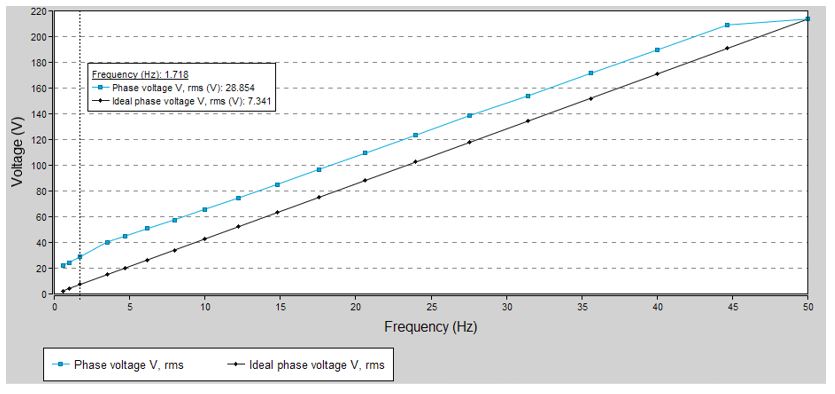
- Voltage versus speed
- Slip versus speed
- Frequency versus speed
- Power (Mechanical power, machine electrical power, system electrical power) versus speed
- Power factor versus speed
- Losses versus speed (total machine and system, Stator Joule, Rotor Joule, mechanical, power electronics) (iron losses are neglected for the first version of this test)
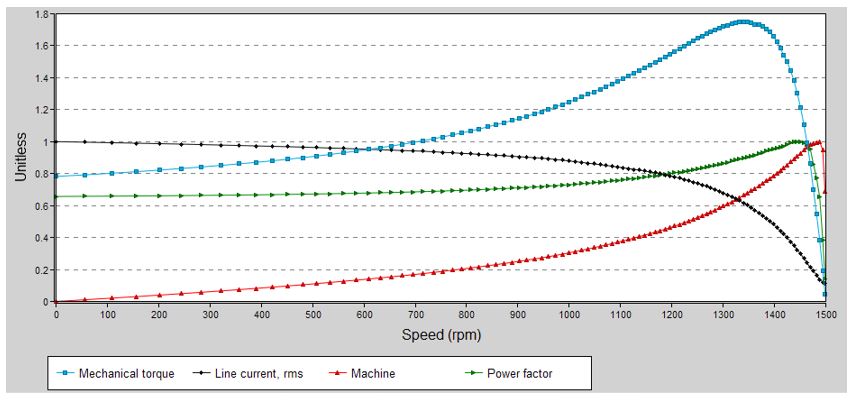
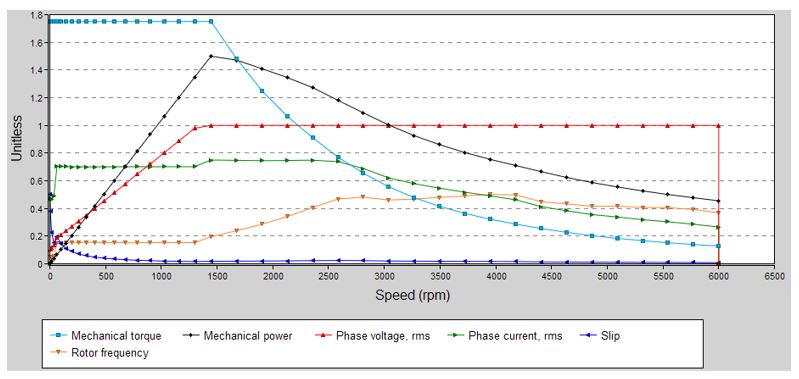
- Characteristic curves
- “Normalized base point curves” versus speed
- “Normalized torque-speed curves” versus speed
- “Voltage boost” versus speed (low speed between zero speed and base speed)
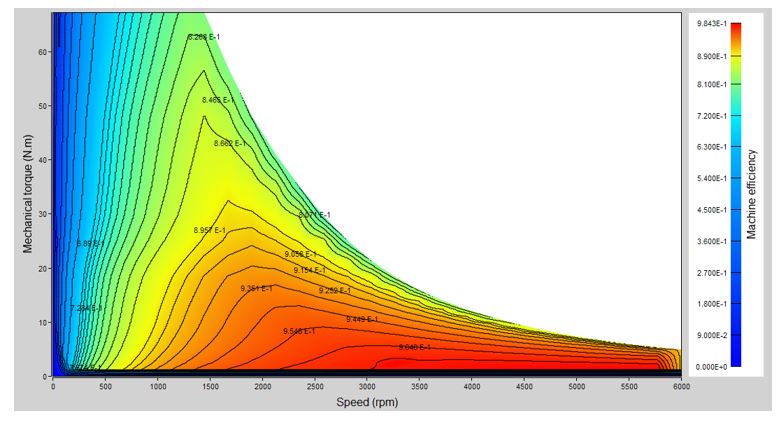
- Torque-Speed maps
- Efficiency in torque-speed area
- Current in torque-speed area
- Voltage in torque-speed area
- Slip in torque-speed area
- Frequency in torque-speed area
- Power (Mechanical power, machine electrical power, system electrical power) in torque-speed area
- Power factor in torque-speed area
- Losses in torque-speed area (total machine and system, total Joule, mechanical, power electronics) (iron losses are neglected for the first version of this test)
- Joule losses in torque-speed area (Total, Stator and Rotor)