Sine wave - Motor - T(slip)
1. Positioning and objective
The aim of the test “Performance Mapping – Sine wave – Motor – T(Slip)” is to characterize the behavior of the machine when operating over a speed range corresponding to a targeted operating mode (“Motor”, “Generator”, “Brake”, “Motor & Generator”, “Motor & Brake” and “Full”). This also corresponds with the operating magnitude of line-line voltage (U) and power supply frequency input values (f).
Hence, these inputs are enough to define a T(Slip) curve and to get additional curves defining all electromagnetic quantities.
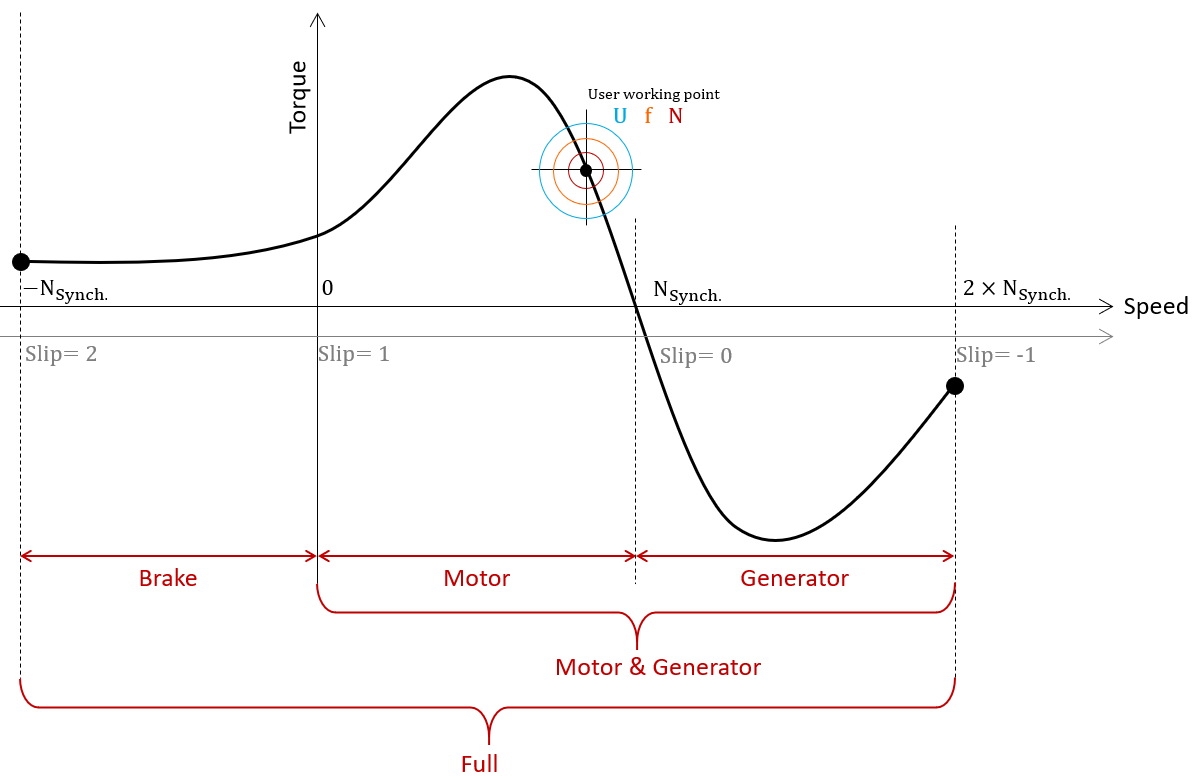 |
| “Performance mapping – Sine wave – Motor – T(Slip)” Illustration |
The results of this test give an overview of the electromagnetic behavior of the machine considering its topology.
For one or more operating modes, the general data of the machine, like mechanical torque, currents, power factor and power balance are computed and displayed as curves.
For the targeted user working point, in addition to the general data, machine constants, flux in airgap and the magnetic flux density in every regions of the machine’s magnetic circuit are also computed for evaluating the design of the machine.
It also gives the capability to make comparisons between results got from the measurements and those got with our solution.
The following table helps to classify the test “Performance mapping – Sine wave – Motor – T(Slip)”.
| Family | Performance mapping |
| Package | Sine wave |
| Convention | Motor |
| Test | T(Slip) |
| Positioning of the test “Performance mapping – Sine wave – Motor – T(Slip)” | |
2. User inputs
The four main user input parameters are the supplied Line-Line voltage, the power supply frequency, the operating mode and the slip at the targeted working point. In addition, temperatures of winding and squirrel cage must be set.
3. Main outputs
Test results are illustrated with data, graphs and tables
3.1 Tables of results
The number of sections where machine performance is displayed depends on the “Operating mode” which is selected. The following table summarize the different cases.
| Operating mode | Starting torque | Break down torque, Motor mode | User working point | Break down torque, Generator mode | Minimum braking torque |
| Motor | X | X | X | ||
| Generator | X | X | |||
| Brake | X | X | |||
| Motor & Generator | X | X | X | X | |
| Full | X | X | X | X | X |
In all these sections, the machine performances are illustrated with the same outputs:
- General data
- Machine constants
- Power balance
- Flux in airgap
- Flux density in iron
3.2 Curves
- Mechanical torque versus slip
- Stator current versus slip
- Efficiency versus slip
- Power factor versus slip
- Power balance versus slip
- Losses versus slip
- Iron losses versus slip
- Joule losses versus slip
- Current density versus slip