Motor - Efficiency Map Scalar Control (U-I)
Positioning and objective
The aim of the test “Performance mapping – Sine wave – Motor – Efficiency map scalar U-I” is to characterize the behavior of the machine in the "Torque-Speed" area.
Input parameters like, “the maximum Line-Line voltage, the maximum line current and the maximum speed” of the machine are considered.
The main difference with the test “Performance mapping – Sine wave – Motor – Efficiency map scalar U-f” is that the speed of the base speed point is not fix by a user input (Rated power supply frequency) but deduced by the internal process of computation to maximize mechanical power.
One type of command mode is available: scalar command.
Input parameters define the torque-speed area in which the evaluation of the machine behavior is performed.
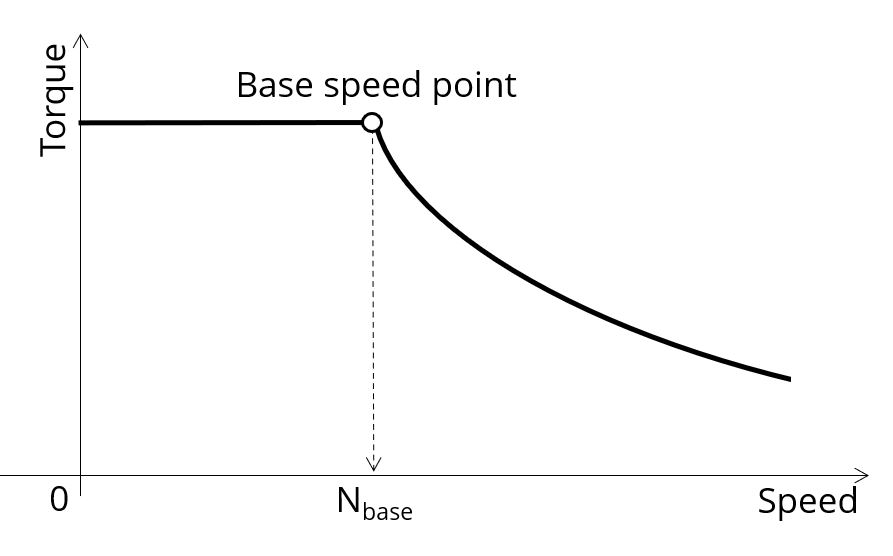 |
| Characterization of the corner point on the torque-speed curve |
In the results, the performance of the machine at the base point (base speed point) and the maximum speed (maximum speed point), set by the user are presented.
A set of curves (like a Torque-Speed curve) and maps (like an Efficiency map) are computed and displayed.
 |
| Mechanical torque versus speed - Example |
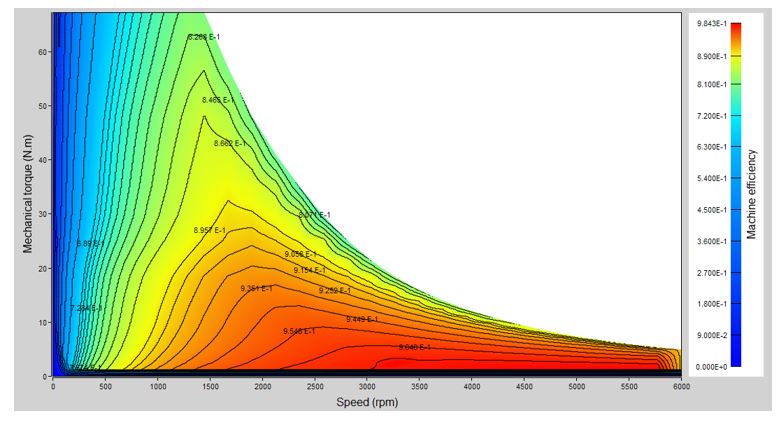 |
| Efficiency in torque-speed area - Example |
Curves are calculated and displayed identical to those presented in the test “Performance mapping – Sine wave – Motor – Efficiency map scalar U-f”.
Please refer to the section dedicated to this test to see the corresponding illustrations.
The following table helps in classifying the test: “Performance mapping – Sine wave – Motor – Efficiency map scalar U-I”.
| Familly | Performance mapping |
| Package | sine wave |
| Convention | Motor |
| Test | Efficiency map scalar U-I |
| Positioning of the test “Performance mapping - Sine wave - Motor - Efficiency map scalar U-I | |
User inputs
Main outputs
Different kinds of output are displayed, like data, curves, maps, and tables.
Main test results
- Machine performance - Base speed point
- General data like torque, speed, electrical powers, power factor, efficiency etc.
- Power balance
- Machine performance - Maximum speed
- General data like torque, speed, electrical powers, power factor, efficiency etc.
- Power balance
- Torque-speed curves
- Mechanical torque versus speed
- Efficiency torque versus speed
- Current versus speed
- Voltage versus speed
- Slip versus speed
- Frequency versus speed
- Power (Mechanical power, machine electrical power, system electrical power) versus speed
- Power factor versus speed
- Losses versus speed (total machine and system, Stator Joule, Rotor Joule, mechanical, power electronics) (iron losses are neglected for the first version of this test)
- Characteristic curves
- “Normalized base point curves” versus speed
- “Normalized envelope curves” versus speed
- “Voltage boost” versus speed (low speed between zero speed and base speed)
- Torque-Speed maps
- Efficiency in torque-speed area
- Current in torque-speed area
- Voltage in torque-speed area
- Slip in torque-speed area
- Frequency in torque-speed area
- Power (Mechanical power, machine electrical power, system electrical power) in torque-speed area
- Power factor in torque-speed area
- Losses in torque-speed area (total machine and system, total Joule, mechanical, power electronics) (iron losses are neglected for the first version of this test)
- Joule losses in torque-speed area (Total, Stator and Rotor)