Doppler analysis is mainly used to obtain insight in the results of automotive radar
simulations, where Doppler shift is critical in subsequent signal processing.
Doppler Shift / Doppler Shift (3D)
To obtain a plot, do the following:
In the results tree, select Power (MS) or
Power. These are the power received by the
receiver antenna and the power received by a hypothetical isotropic antenna,
respectively.
Select the time step of interest (if it was a time-variant simulation).
Click Display > Doppler Analysis and select one of the following:
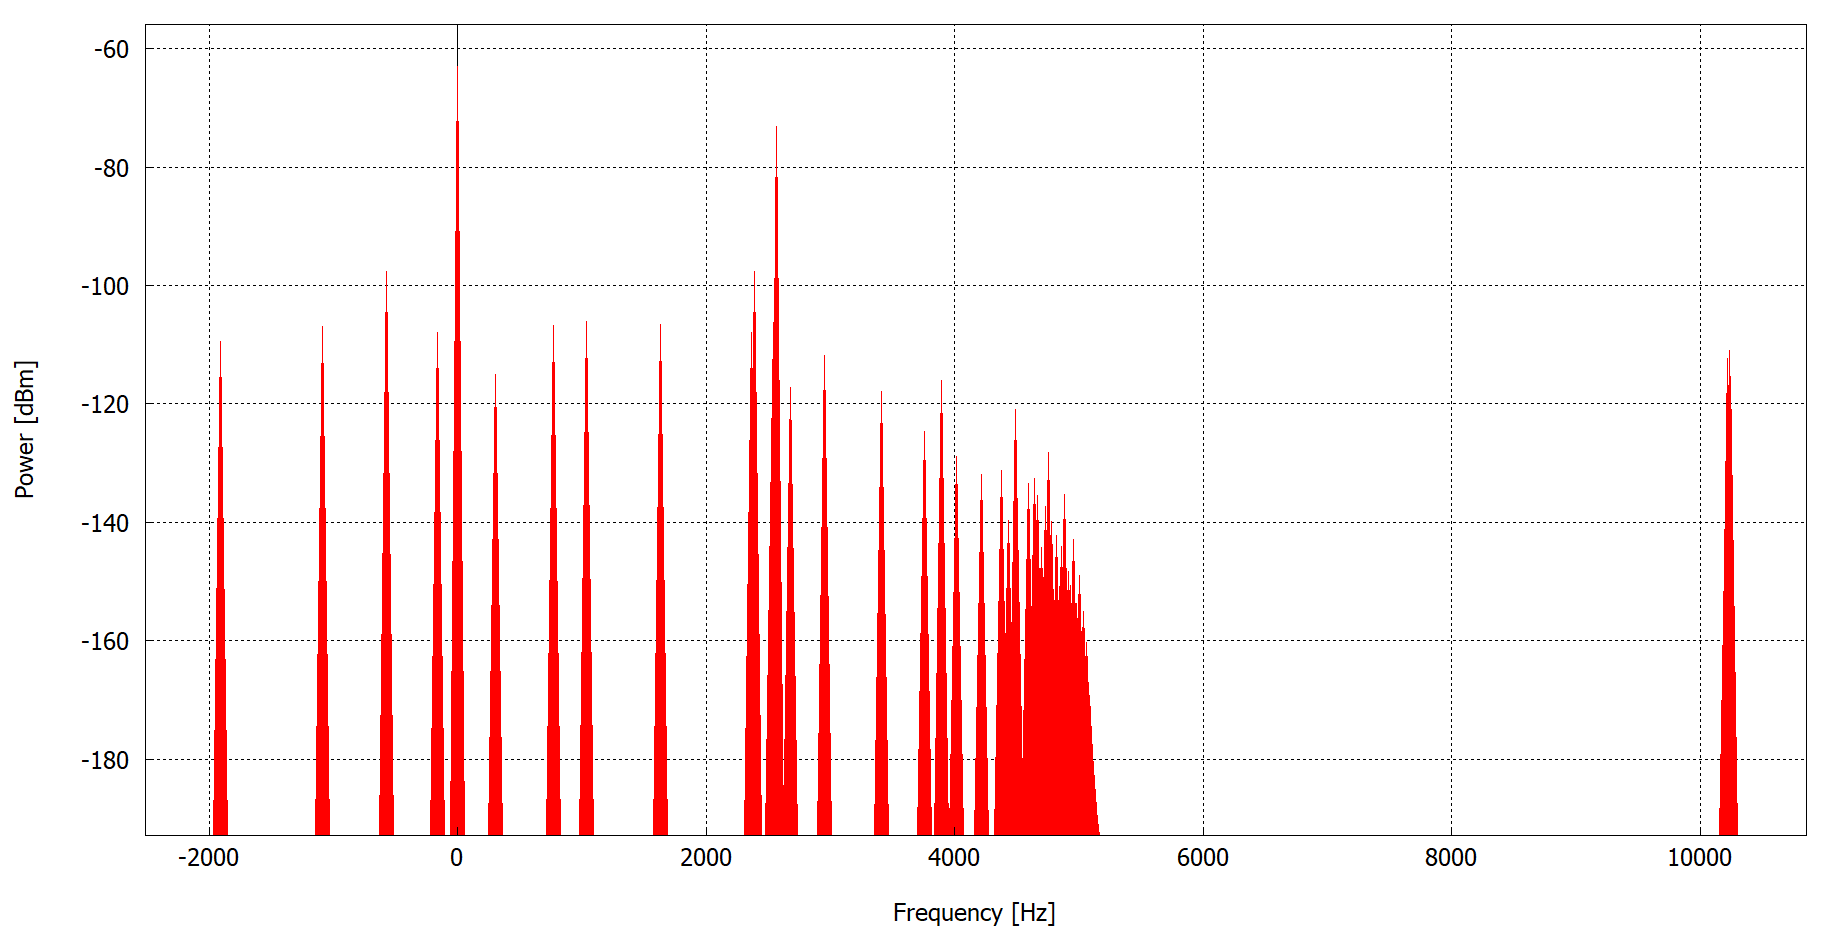
Doppler Shift
Hover the cursor over the result pixel of interest for
Doppler shift.Figure 1. A graph showing for all contributing rays the
Doppler shift along the horizontal axis and the
power along the vertical axis.
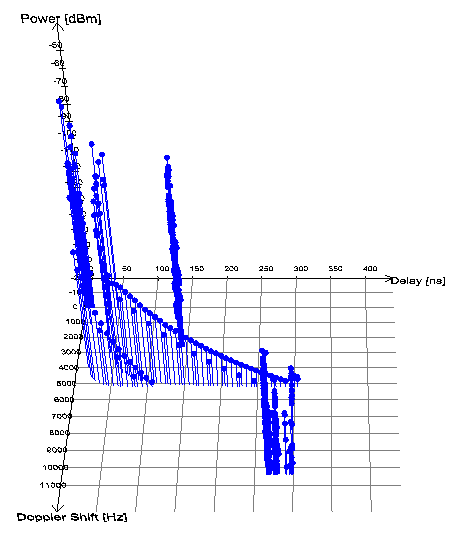
Doppler Shift (3D)
Click on the pixel of interest. In an automotive radar
simulation, there is often just one result pixel, located at
the radar position.
Tip: Zoom in if needed to
view the result pixel.
Figure 2. A 3D plot showing for all contributing rays the
Doppler shift and the signal delay along the two
horizontal axes and the power along the vertical
axis.
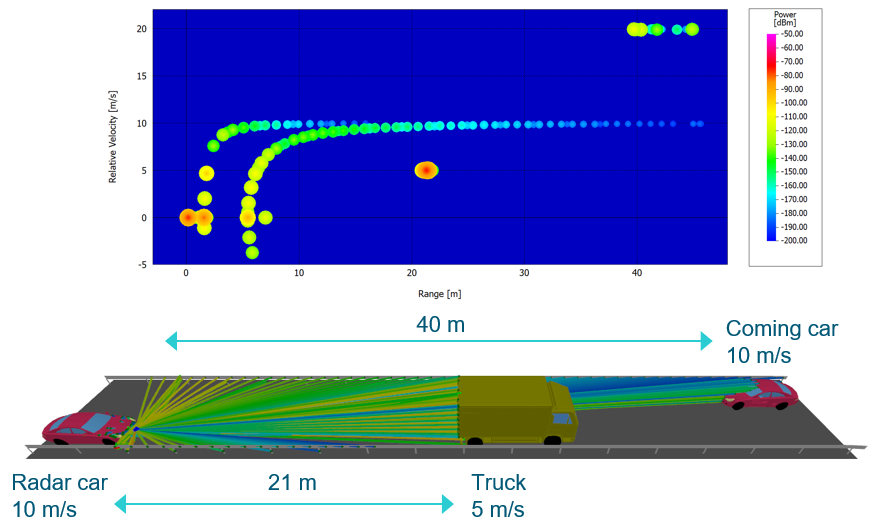
Doppler Heat Map
Plot radar results as a heat map, with range and relative velocity along the axes and
signal strengths as colors. To obtain a Doppler Heat Map, do
the following:
In the results tree, select Power (MS) or
Power. These are the power received by the
receiver antenna and the power received by a hypothetical isotropic antenna,
respectively.
Click Display > Doppler Heat Map.
Click on the radar pixel to generate the heat map.
[Optional] Activate/deactivate the legend on the plot by right-clicking on
the plot and click Settings > Layout and select/clear the Display Legend
check box.
Figure 3. A heat map for the radar channel profile with range and velocity along
the axes.