
OS-T: 2080 Hook with Stress Constraints
In this tutorial you will perform a topology optimization on a bracket-hook modeled with shell elements.
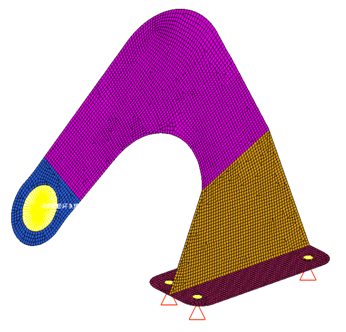
The structural model is loaded into HyperMesh Desktop. The constraints, loads, subcases and material properties are already defined in the model. The topology design variables and the optimization problem setup will be defined using HyperMesh, and OptiStruct is used to determine the optimal material layout. The results can then be reviewed in HyperView.
- Objective Function
- Minimize mass.
- Constraints
- Minimum Member Size = 1.0
- Design Variables
- The density of each element in the design space.
Launch HyperMesh and Set the OptiStruct User Profile
-
Launch HyperMesh.
The User Profile dialog opens.
-
Select OptiStruct and click
OK.
This loads the user profile. It includes the appropriate template, macro menu, and import reader, paring down the functionality of HyperMesh to what is relevant for generating models for OptiStruct.
Import the Model
-
Click .
An Import tab is added to your tab menu.
- For the File type, select OptiStruct.
-
Select the Files icon
 .
A Select OptiStruct file browser opens.
.
A Select OptiStruct file browser opens. - Select the hook.fem file you saved to your working directory.
- Click Open.
- Click Import, then click Close to close the Import tab.
Set Up the Optimization
Set the View
- In the Model Browser, right-click on Components and select Isolate Only from the context menu.
-
From the Standard Views toolbar, click
 to fit the model to the
screen.
to fit the model to the
screen.
Create Topology Design Variables
In this step you will set the optimization to optimize the shell elements in the Design and Base components to create structural members with minimum member size of 1.0 unit in width with thicknesses that vary between zero and the thickness of the shell. The optimization will use 1000 as the maximum stress for any element within the design region when validating the design.
- From the Analysis page, click optimization.
- Click topology.
- Select the create subpanel.
- In the desvar= field, enter shells.
- Set type: to PSHELL.
- Using the props selector, select Design and Base.
- Click create.
-
Update the design variable's parameters.
- Select the parameters subpanel.
- Toggle minmemb off to mindim=, then enter 1.0.
- Under stress constraint, toggle none to stress= and enter 1000.
- Click update.
- Click return.
Create Optimization Responses
- From the Analysis page, click optimization.
- Click Responses.
-
Create the mass response, which is defined for the total volume of the
model.
- In the responses= field, enter mass.
- Below response type, select mass.
- Set regional selection to total and no regionid.
- Click create.
- Click return to go back to the Optimization panel.
Apply Constraints
Define the Objective Function
- Click the objective panel.
- Verify that min is selected.
- Click response= and select mass.
- Click create.
- Click return twice to exit the Optimization panel.
Save the Database
- From the menu bar, click .
- In the Save As dialog, enter hook_opt.hm for the file name and save it to your working directory.
Run the Optimization
- From the Analysis page, click OptiStruct.
- Click save as.
-
In the Save As dialog, specify location to write the
OptiStruct model file and enter
hook_opt for filename.
For OptiStruct input decks, .fem is the recommended extension.
-
Click Save.
The input file field displays the filename and location specified in the Save As dialog.
- Set the export options toggle to all.
- Set the run options toggle to optimization.
- Set the memory options toggle to memory default.
-
Click OptiStruct to run the optimization.
The following message appears in the window at the completion of the job:
OPTIMIZATION HAS CONVERGED.
FEASIBLE DESIGN (ALL CONSTRAINTS SATISFIED).
OptiStruct also reports error messages if any exist. The file hook_opt.out can be opened in a text editor to find details regarding any errors. This file is written to the same directory as the .fem file. - Click Close.
View the Results
View the Iso Surface Plot of the Density Results
-
In the Mechanical Solver View dialog, click
Results.
The results of the Optimization run and the corresponding Linear Static subcases are loaded into HyperView.
-
Review the Contour plot of element density results.
-
From the Results toolbar, click
 to open the Contour panel.
- Set the Result type to Element Densities[s].
- Click Apply to display the density contour.
- In the Results Browser, select Design and Iteration 26 (or your final iteration number).
Figure 2. 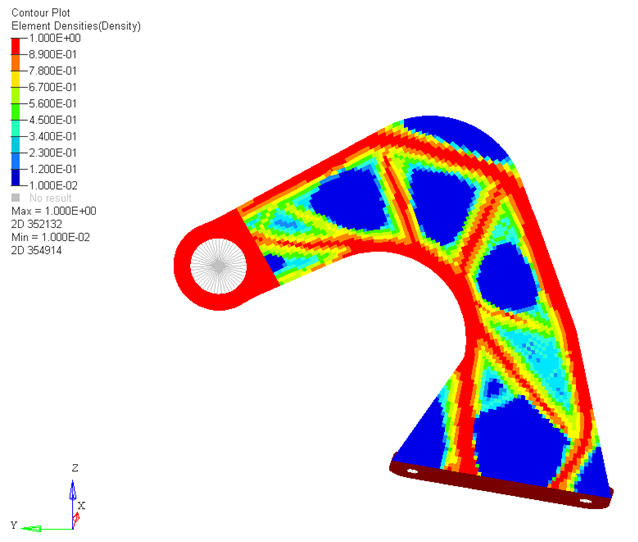
-
From the Results toolbar, click
-
Review the Iso Value plot of element density results.
-
From the Results toolbar, click
 to open the Iso Value panel.
-
In the Results Browser, select the last design
iteration.
Figure 3. 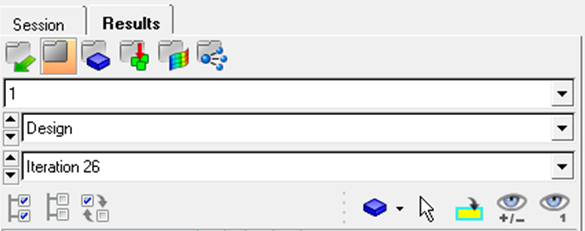
Figure 4. Iso Value Plot. Current value=0.4528 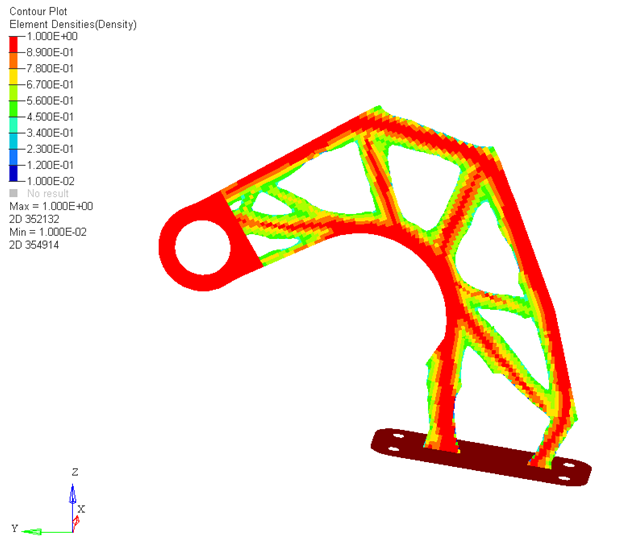
-
From the Results toolbar, click
View the Element Stress Results
-
In the top, right of the application, click
 to move to the page which displays results from the Linear Static Analysis of
Subcase 1.
The results is this page are loaded from hook_opt_s19.h3d, and contain the linear static results for the 1st subcase.
to move to the page which displays results from the Linear Static Analysis of
Subcase 1.
The results is this page are loaded from hook_opt_s19.h3d, and contain the linear static results for the 1st subcase. -
From the Results toolbar, click to open the Contour panel.
- Set the Result type to Element stresses(2D&3D)(t) and vonMises.
- In the Results Browser, select the last displayed Iteration.
-
In the Contour panel, click
Apply.
Figure 5. von Mises Stress Results 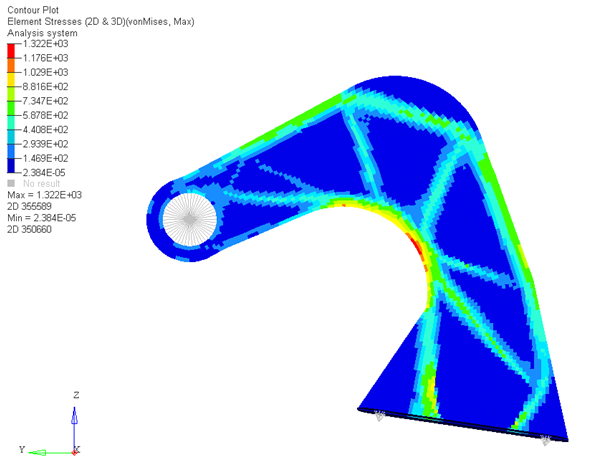
- Similarly, review the results from the other subcases.
You will notice that there are some local regions where the stresses are still high; this is because topology stress constraints should be interpreted as global stress control or global stress target.