Query Data for Surface Plots
Tutorial Level: Intermediate In this tutorial, you will learn how to query data from the surface plot and create and use datum planes.
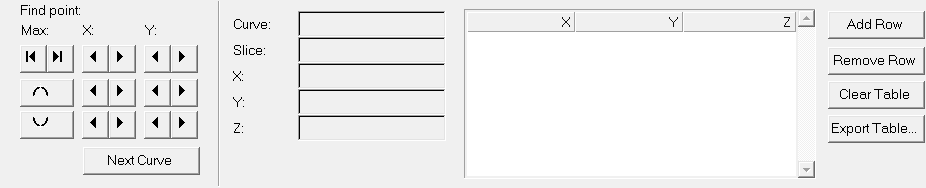
The Values panel allows you to retrieve individual point data on any curve in the active window. When a point on a curve is selected, the point data is displayed on the panel and in a bubble in the graphics area of the screen. Use the Values panel to retrieve data from three curve types: 3D line, surface, and waterfall. The panel options change depending on the curve in the active window.
The Values panel allows you to retrieve individual point data on any curve in the active window. When a point on a curve is selected, the point data is displayed on the panel.
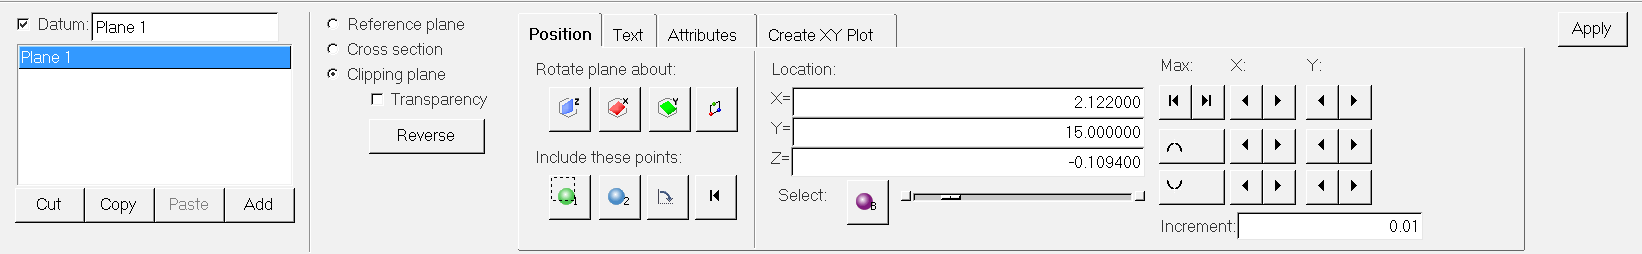
The Datums panel allows you to insert reference datum planes to plots.
Open Session File
- From the menu bar, select .
-
Select the file Curve_Attributes_Surface.mvw and click
Open.
Figure 5. 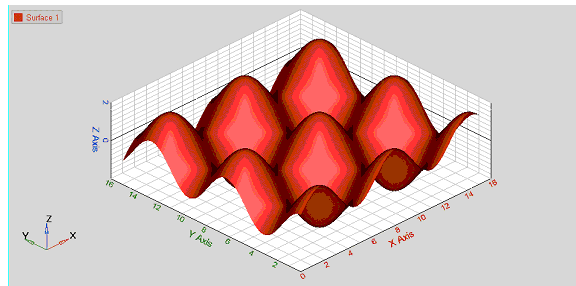
Query XYZ Values Using the Values Panel
-
From the 3D Chart ribbon, click the Values tool.
Figure 6. 
Note: A bubble with the XYZ values is seen in the graphics area. -
Click the surface to see the XYZ values at that point.
Note: The panel area displays the XYZ values of the point chosen.
- Click Add Row to add an additional row.
-
Click on another point on the surface.
The value in the newly added row is updated to that of the new point.
-
Repeat the operation to build a table.
Figure 7. 
- Click any one of the rows in the table and click Remove Row.
- Click Export Table… and save the table as a DAT file.
Use Datum Planes as Reference Planes
-
From the 3D Chart ribbon, click the Datums tool.
Figure 8. 
- Verify that the Position tab is active and the radio button for Reference Plane is checked.
-
Click Add to add a datum plane as a reference plane.
By default, a reference plane is created in the Z plane.
-
Move the slider bar in the panel area to move the reference plane along the Z
plane.
Figure 9. 
-
Click the icons
 and
and  to change the orientation of the plane along the X and
Y axis, respectively.
to change the orientation of the plane along the X and
Y axis, respectively.
-
Click
 to create a plane with three points of your
choice.
to create a plane with three points of your
choice.
Figure 10. 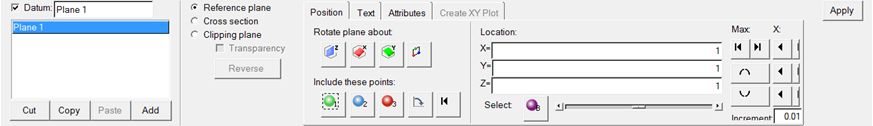
-
Under Location, enter 1 for the X, Y, and Z axis,
respectively.
You can also pick three points from the screen.
- Click Apply.
-
Click
 and
and  to move the reference plane to the maximum and minimum
point in the surface plots, respectively
to move the reference plane to the maximum and minimum
point in the surface plots, respectively
-
Click the arrows,
 , to move to the next/previous point or to the local
maximum/ local minimum along the X and Y axis.
, to move to the next/previous point or to the local
maximum/ local minimum along the X and Y axis.
Use Datum Planes as Clipping Planes and Plot Cross Section
- Create a Reference plane parallel to the Z-axis by selecting Rotate plane about X. Move the slider bar to position the datum plane in the middle of the surface plot.
- Activate the radio button for Clipping Plane.
-
Activate Transparency.
The clipped part of the surface plot appears transparent on the screen.
-
Move the slider bar and note the change in the clipping area from the
screen.
Figure 11. 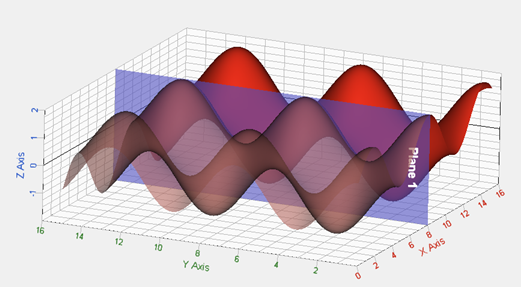
- Turn the Transparency option off.
- Click the Create XY Plot tab.
- Verify that the option for Place curve on is set to New plot.
- Set Create curve: to Y vs Z.
-
Click Plot Data.
Figure 12. 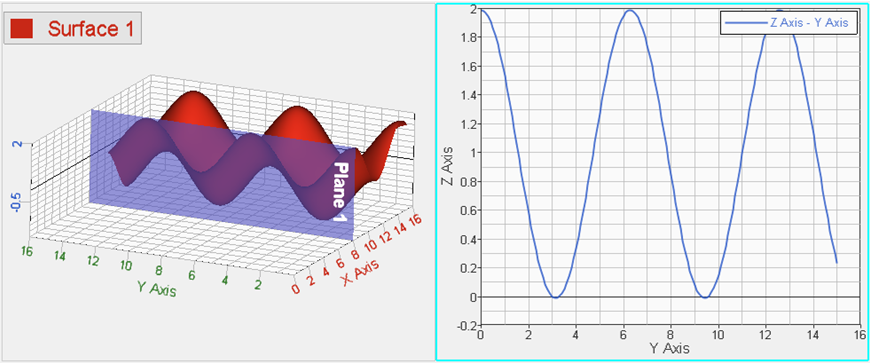
- Click the Position tab.
-
Move the slider bar to update the position of the clipping plane.
The plot updates simultaneously.
- Click the plot window to make it active.
-
Click the Fit icon,
 , to fit the plot to the window.