Adding Cursors and a Cursor Table
Use cursors and its cursor table to read and interpret information from a graph. Place cursors at predefined positions.
-
Enable cursors on the graph.
-
On the Measure tab, in the
Measurement group, click the
 Cursors icon.
-
On the Measure tab, in the
Measurement group, click the
-
Add a cursor table to the graph.
-
On the Measure tab, in the
Measurement group, click the
 Cursor table icon.
Figure 1. A Cartesian graph with cursor table. 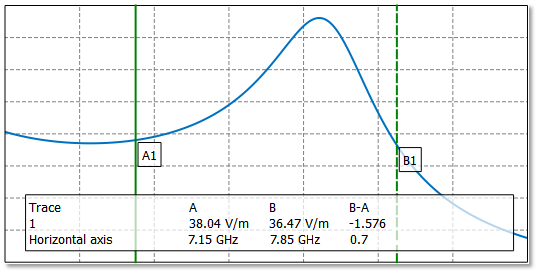
Note: The table contains the data for the displayed points as well as the difference (indicated by B-A).Tip: If you move the cursor outside of the visible region of a graph, a handle appears to retrieve the cursor. -
On the Measure tab, in the
Measurement group, click the
-
Set the cursor position to a predefined position. For example, place the cursor
at the global maximum of the selected trace.
- Select the trace where you want to find the global maximum.
-
On the Measure tab, in the
Measurement group, click the
 Global maximum icon.