Cartesian Surface Graphs
A Cartesian surface graph is a flat colour plot with results plotted against two independent axes.
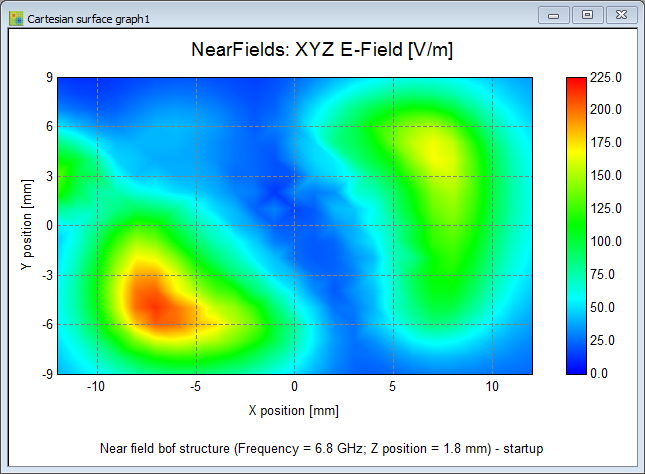
The surface graph allows you to plot quantities like radar cross section (RCS), gain
or near fields as a function of two as a function of two independent parameters,
such as angles theta and phi or frequency and position.
Note: Only a single plot per
Cartesian surface graph is supported.
| Result type | Cartesian surface graph |
|---|---|
| Far fields (including RCS) | |
| Near fields | |
| Error estimates | |
| Currents | |
| Rays | |
| Sources | |
| Loads | |
| S-parameters | |
| Power | |
| Probes | |
| Transmission / reflection coefficients | |
| Characteristic modes | |
| Imported data | |
| Script data / custom datasets | |
| Optimisation | |
| Receiving antenna | |
| SAR |