Adding a Custom Point Annotation
Add a custom point annotation to a Cartesian surface graph to read the value of a point and highlight this point of interest on the graph.
-
On the Surface context
tab, on the Measure tab, on the Custom annotations group, click the
 Point icon. From
the drop-down list, select Specify independent axis value.
Point icon. From
the drop-down list, select Specify independent axis value.
Figure 1. The Configure annotation dialog. 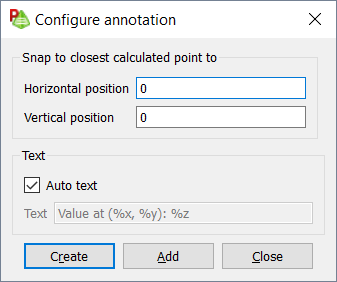
- In the Horizontal position field, specify a value on the horizontal axis.
- In the Vertical position field, specify a value on the horizontal axis.
-
Specify the text displayed in the annotation.
- To specify text, clear the Auto text check box. In the Text field, enter the custom text.
- To add text containing the X value and Y axis, select the Auto text check box.
- Click Create to add the annotation and to close the dialog.