Changing the Sampling Settings
Specify the number of samples for continuous results displayed on graphs.
- Select the graph for which you want to modify the sampling.
-
On the Trace tab, in the
Units group, click the
 Sampling settings icon.
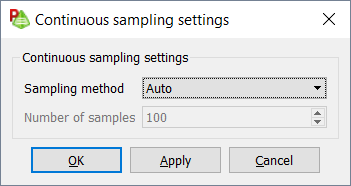
Figure 1. The Continuous sampling settings dialog. 
-
From the Sampling method
drop-down list, select one of the following:
- To display the default rendering where the sampling is determined based on the data, select Auto.
- To display only the actual samples, select Discrete.
- To resample the data and display a fixed number of discrete points, select Specify number of samples.
Tip: To export continuous data, use Specify number of samples or Discrete samples to limit the number of samples (file size). - Click OK to set the sampling settings and to close the dialog.