Learn how to review, examine, and analyze the results of the simulation using
EDEM Analyst.
To analyze the simulation results:
Click the icon
on the Toolbar.
Use the controls below the simulation window to rewind the simulation to the first Time
Step.
Click the
icon to play through each Time Step of your simulation.
Configure the Display
The Display section in the Analyst Tree is used to configure the appearance of the
different elements in your model. The Geometry, particles, and contacts within your model
can also be colored in a variety of ways. Any section of a Geometry, particle, contact type,
or selection group can be colored independently.
To configure the Display Section:
Configure the Geometries subsection.
Click Display in the Analyst Tree and then expand
the Geometries subsection.
Select different Geometries and modify their display in the Detailed
View.
For example, use the Display Mode
dropdown list to make the hopper transparent, guides as mesh, and
the belt fully opaque. Options are: Filled, Mesh, or Points. The
Opacity can have values between 0-1, with 0 being completely
transparent and 1 being solid.
Ensure that the Display Factory checkbox is not
selected, so that it is not visible in the Viewer Window.
Other Geometries should be displayed as
Filledwith 0.5
Opacity.
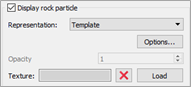
Configure the Particles subsection.
You can modify the display of the particles in a similar way to that of the
Geometries. In addition, you can represent the particles using vectors,
cones, streams, and particle templates.
Select and expand the Particles section in the
Analyst tree and then select rock particle.
Select Template from the
Representation dropdown list in the Detailed
View.
Click Options..., set the Template to
Rock Template and then click
OK.
In large simulations, a template
representation can put a high demand on system resources.
Watch the simulation step-by-step by using the controls located at the
lower section of the Viewer window.
Set the Representation back to
Default before proceeding.
Note: The template in the Analyst is for display
purposes only, and does not change the simulation results. In the
Creator, the particle mass, volume, and inertia can be calculated
from a template. If you have selected this approach, the same
template must be used for display purposes.
Color the particles according to their mass.
Select rock particle in the
Particles subsection of the Analyst Tree.
In the Coloring section of the Detailed View,
select Color by Mass from the dropdown list.
Select 3 from the Levels
dropdown list, and set the Min,
Mid, and Max colors to
Blue, Green and Red respectively.
Do not select the Smooth Colors checkbox.
Click the icon next to the Min
Value and Max Value fields to
read the current values from the point in the simulation being displayed
in the Viewer.
Do not select the Auto Update checkbox.
Set Min to 0 kg and
Max to 0.8 kg to allow
the maximum value in the simulation to be displayed instead of the
instantaneous maximum mass value.
Select the Show Legend checkbox.
Click the icon to view the distribution of mass over
time.
Color the belt Geometry by velocity.
Expand the Geometries subsection in the Analyst
Tree.
Select the belt Geometry element.
In the Coloring section of the Detailed View,
select Velocity from the Color
by dropdown list.
Set the Min, Mid, and
Max colors to Dark Grey, Green, and Red
respectively.
Set the Min and Max values
to 0 m/s and 2 m/s.
Play through the simulation to see how the belt velocity changes with
time. You can also plot and export this data.
Create Selections
Selections allow you to extract data from a particular volume or element in the
domain. Using selections, you can monitor any element passing through a particular volume
(known as a 'bin') or track particular elements as they move within the domain. You can then
display, color, plot, or export data based on these selections.
To create Selections:
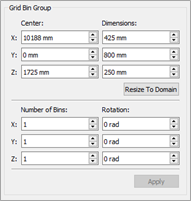
Create a Grid Bin Group.
You can compare the total mass of particles falling off the end of the
conveyor belt with the mass of particles falling off the bottom of the lower
hopper. To do so, create two grid bin groups each containing one bin.
Right-click Setup Selections in the Analyst Tree.
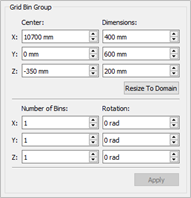
Navigate to Add Selection > > Grid Bin Group and name it Conveyor group.
Select the newly created Grid Bin Group and in the Detailed View, set
its properties as follows:
Click Apply.
Right-click Setup Selections to create a second
Grid Bin Group and name it Hopper_group.
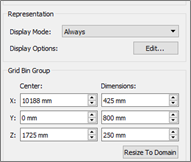
Set the properties of the Grid Bin Group and then click
Apply:
Define the Selection group queries.
A query is used to define a single element attribute, for example particle
velocity, total force on a Geometry section, or number of collisions.
To compare the total mass of particles passing through the first bin
group with the number passing through the second, set the Current Time
to about 6.3s.
Use the controls at the lower section of the Viewer
window or type the current time desired in the Time Step section in
the menu bar. This is the last Time Step before any particles leave
the conveyor belt.
Select Conveyor_group in the Setup
Selections section of the Analyst Tree.
In the Options section of the Detailed View,
click Edit….
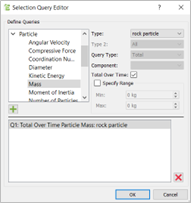
The Selection Query Editor is displayed.
Expand Particle and then select
Mass.
Set Type to rock particle and Query
Type to Total.
Select the Total Over Time checkbox and then
click OK.
The query is displayed in the dialog
box.
Repeat the same steps to define an identical query for the
Hopper_group.
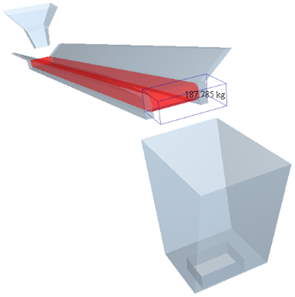
Set the Selection group display options.
In the Setup Selections section of the Analyst
Tree, select Conveyor_group.
In the Representation section of the Detailed
View, click Edit... to edit the display
options.
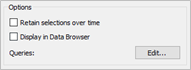
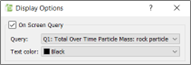
The Display Options dialog box is displayed.
Select the On-Screen Query checkbox to display
the mass in the Viewer:
Repeat the same steps for the Hopper_group.
Click the icon to view the results in real time.
As the playback continues through the Time Steps, bin group data
is collected and displayed.
Extract Data
You can now export the data collected during your simulation for analysis. The data
can be exported from a single Time Step, a range of Time Steps, all the elements in a model,
or a selection or bin group.
To extract data:
Create an export configuration.
Select File > Export > Results Data.
The Export Results Data dialog box is displayed.
Click the icon under Configuration
ID to create a new configuration.
A single
configuration can contain multiple queries and can be reused at any
point in your model.
Set the Export Format to
Text to extract data to a .csv file.
Enter the file name as Conveyor and then set the
save location to the tutorial folder.
Define a query to export Total Over Time queries for each bin group.
In File > Export > Results Data, go to the General tab.
Select the Output Averages,
Maximums, Minimums,
and Totals in Columns checkboxes.
In the Time Steps section, clear the
All checkbox and then set the range to start
at about 6.3s.
Select the Queries tab to define the data to be exported.
Click the icon to create a new query.
Expand Particle and then select
Mass.
Set the Type to rock particle.
Select Conveyor_group.
Select the Total Over Time checkbox and then
click OK.
Repeat the same steps to add a second query for the Hopper_group.
Export the data.
Click Export to export the data to the
pre-defined file (Conveyor.csv).
Open the file in an external application (such as a spreadsheet editor)
and review the data.
 icon
on the Toolbar.
icon
on the Toolbar.
 below the simulation window to rewind the simulation to the first Time
Step.
below the simulation window to rewind the simulation to the first Time
Step.
 icon to play through each Time Step of your simulation.
 icon next to the Min
Value and Max Value fields to
read the current values from the point in the simulation being displayed
in the Viewer.
icon next to the Min
Value and Max Value fields to
read the current values from the point in the simulation being displayed
in the Viewer. 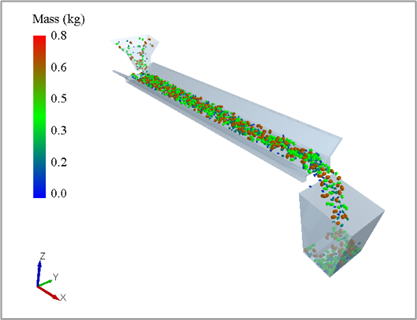

 icon under Configuration
ID to create a new configuration.
icon under Configuration
ID to create a new configuration.