Definition
B(H) curve – multi-segments
The B(H) curve is defined with a series of segments. The user must give the list of points (B, H) to define the corresponding segments.
 |
|
|---|---|
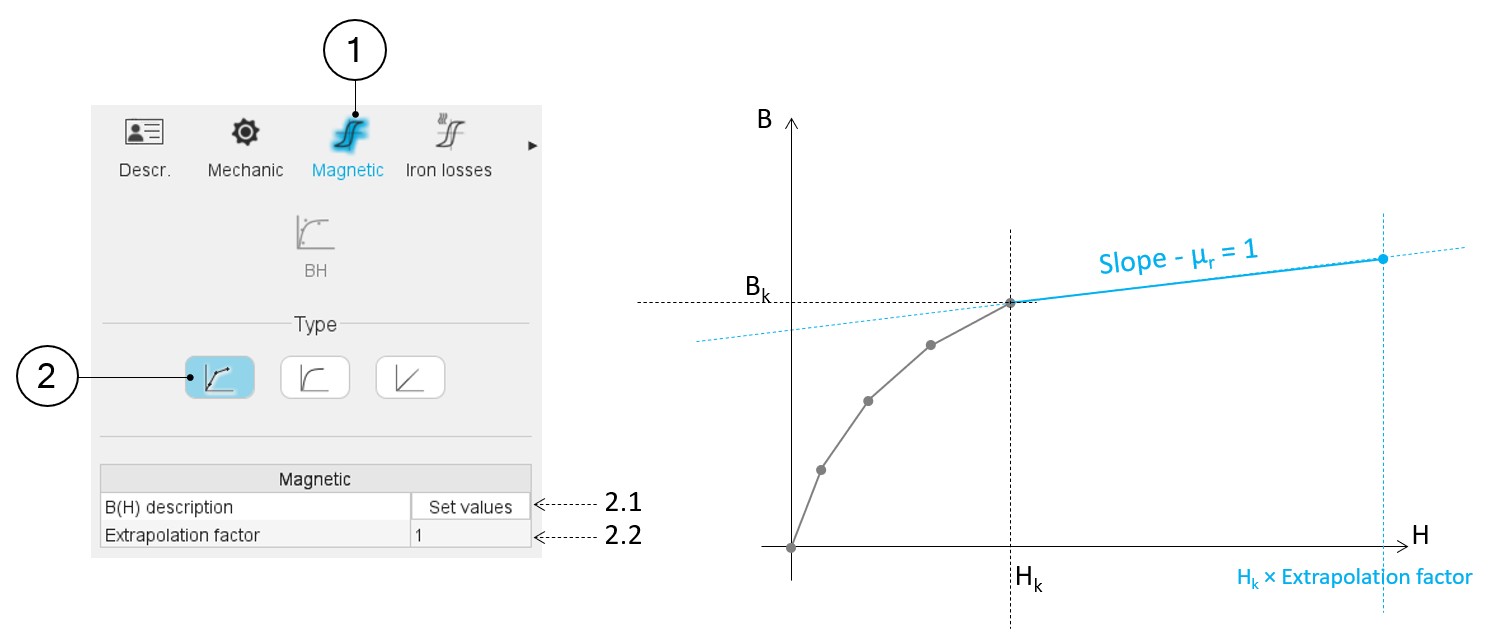
| 1 | When editing the properties of an existing material (lamination and solid families), a category is dedicated to the magnetic data. Hence, clicking on the “Magnetic” one can define the B(H) curve. |
| 2 | Selection of the multi-segment model. |
| 2.1 | Set a list of B-H points that describe all the segments for building the B(H) curve. Clicking on this field opens a dialog box in which a table must be filled. See the illustration below. |
| 2.2 | The extrapolation factor allows us to define the slope of the
B(H) curve after the last point given by the user. The aim is to ensure that this slope is equal to 1 (i.e. relative permeability equal to 1). This coefficient is applied to the maximum magnetic field given by the user to define the very last point of the B(H) curve to be considered. The slope equal to 1 is applied to the segment between this point and the last one given by the user, as illustrated in the picture above. |
 |
|
|---|---|
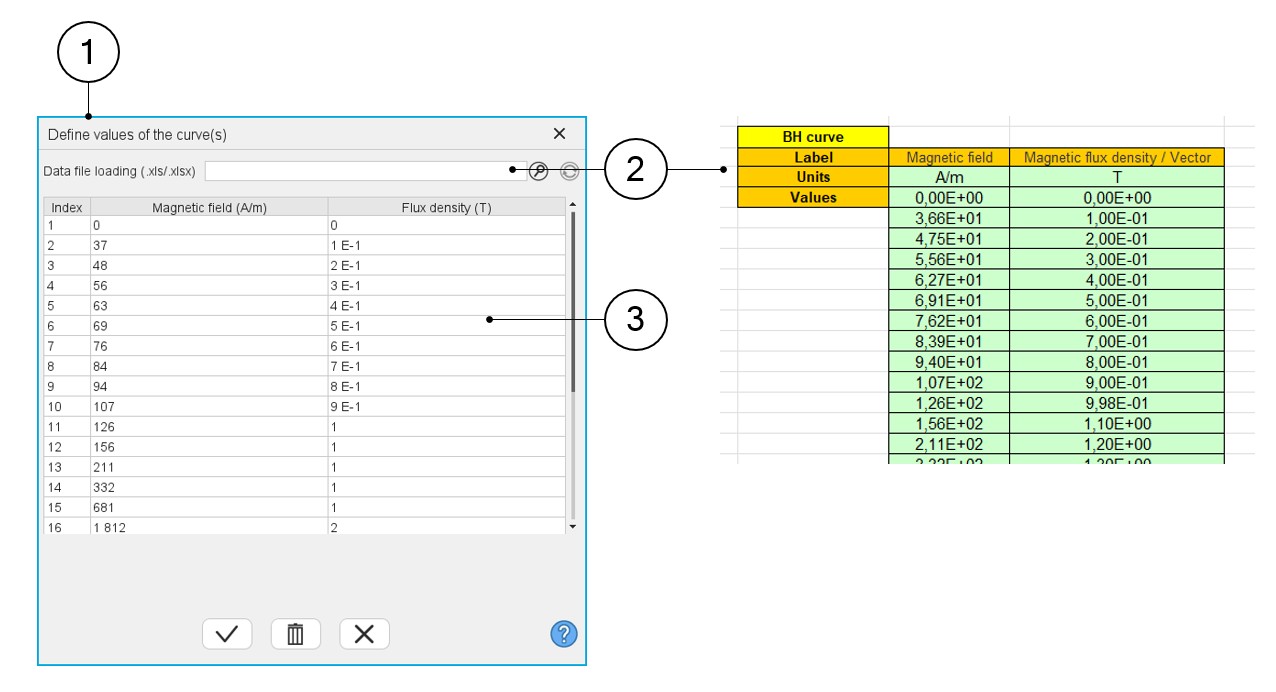
| 1 | Dialog box to describe the B(H) curve with a list of points (B, H). |
| 2 | The building of the multi-segments B(H) curve can be done with an
Excel file. This field helps the user to browse and find the Excel
file to be considered. Note: The format needed
to create the Excel file is illustrated above. |
| 3 | Table in which the list of points must be defined, manually or via an import of an Excel file content. |
It allows to see what the correct format is to be applied for filling the data.