Gaz properties
Introduction
Here is the process to define and fit the gas thermal characteristics from the importation of a series of points representing the considered quantity curve listed in an Excel file. In the following example air mass density is considered; however, the same principle is applied for all other gas properties depending on temperature, which are defined below.
 |
|
|---|---|
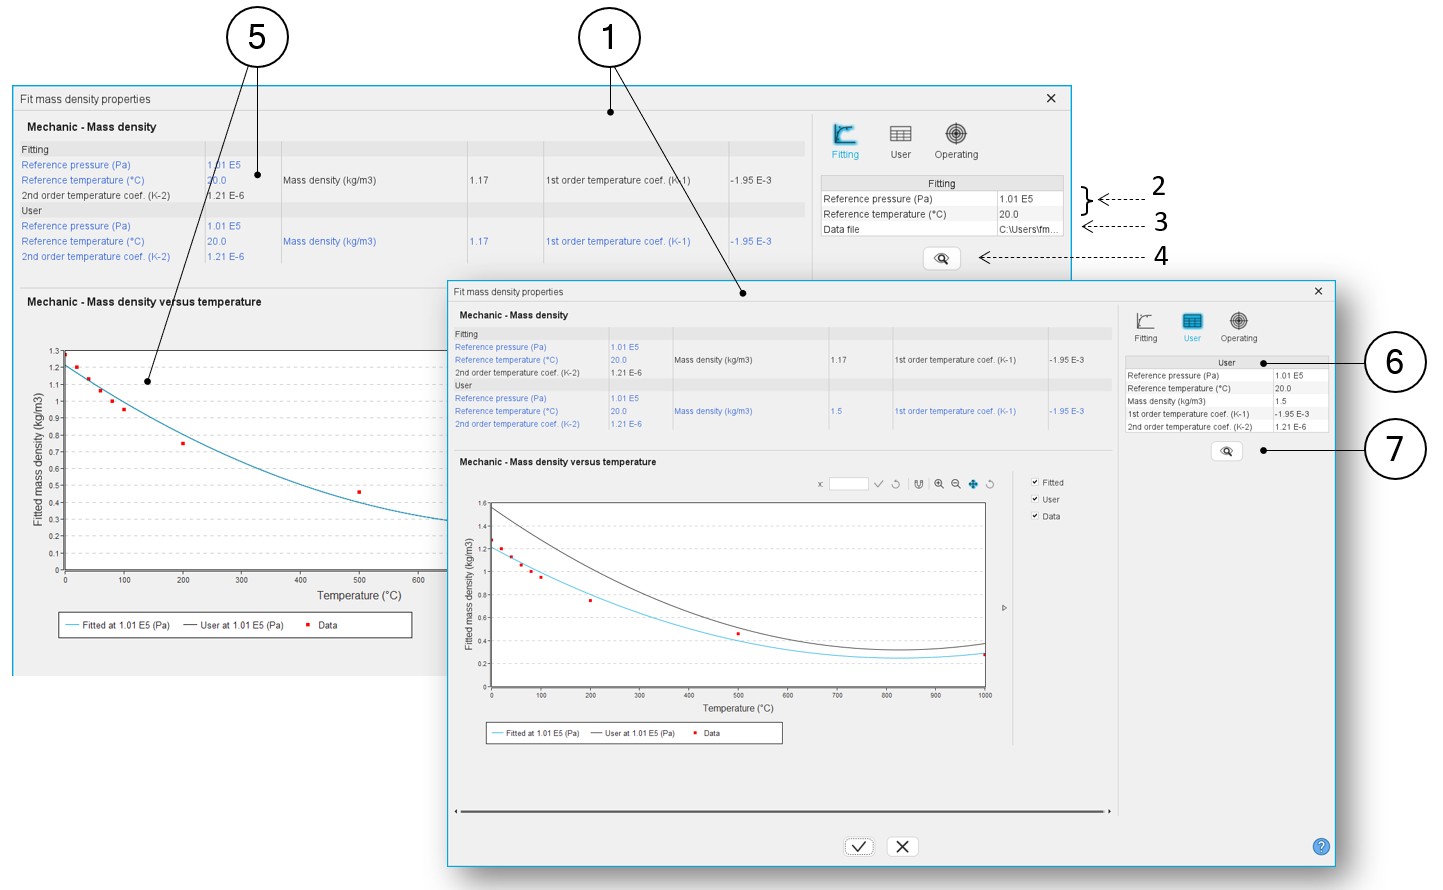
| 1 | Dialog box allowing the characterization of the density curve imported from an Excel file |
| 2 | Select the reference conditions (temperature and pressure) associated with the measures contained in the Excel file. |
| 3 | Path where the Excel file containing the measures is stored. See an example of Excel file below. |
| 4 | Click on this button to import the Excel data. |
| 5 | When importing an Excel file, points representing the density
curve are listed, and an optimization process automatically computes
and displays the corresponding characteristics. Three curves are
displayed:
|
| 6 | Indeed, going to the tab “User”, the user can adjust one or all
the main parameters of the density curve.
Reference temperature and pressure can also be adjusted in this tab. |
| 7 | It is possible to select an operating pressure to visualize the
behavior of the resulting mass density curve. Operating pressure
should be chosen in the “Operating” tab. Note:
If the chosen pressure is not the same as the one used for the
fitting process, the measurement points (in red) will not be
displayed. |
Example of an Excel file to define the mass density curve parameters.
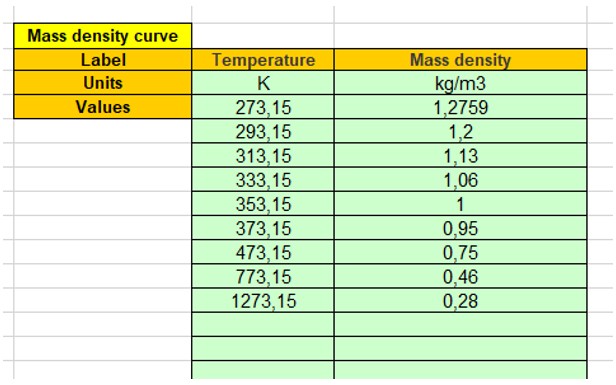
It allows to see what the correct format is to be applied for filling the data.
Mass density
| Symbol | Definition | Unit |
| P ref | Reference pressure | Pa |
| T refD | Mass density reference temperature T refD | °C |
| r ref | Mass density at T refD and P ref | kg/m3 |
| a | Mass density first order temperature coefficient at T refD and P ref | K-1 |
| b | Mass density second order temperature coefficient at T refD and P ref | K-2 |
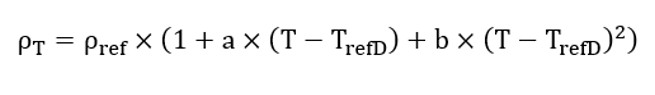
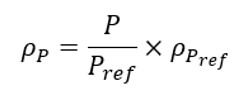
The mass density ρ computed at a pressure P is computed as below:
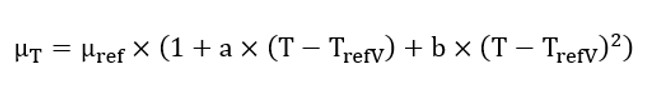
Dynamic viscosity
| Symbol | Definition | Unit |
| T refV | Dynamic viscosity reference temperature | °C |
| μref | Dynamic viscosity at T refV | kg/m/s |
| a | Dynamic viscosity first order temperature coefficient at T refV | K-1 |
| b | Dynamic viscosity second order temperature coefficient at T refV | K-2 |
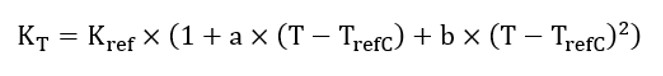
Thermal conductivity
| Symbol | Definition | Unit |
| T refC | Thermal conductivity reference temperature | °C |
| K ref | Thermal conductivity at T refC | W/K/m |
| a | Thermal conductivity first order temperature coefficient at T refC | K-1 |
| b | Thermal conductivity second order temperature coefficient at T refC | K-2 |
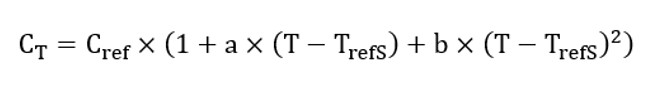
Specific heat
| Symbol | Definition | Unit |
| T refS | Specific heat reference temperature | °C |
| C ref | Specific heat at T refS and P ref | J/K/Kg |
| a | Specific heat first order temperature coefficient at T refS and P ref (K-1) | K-1 |
| b | Specific heat second order temperature coefficient at T refS and P ref (K-2) | K-2 |
The specific heat C computed at a pressure P is computed as below:
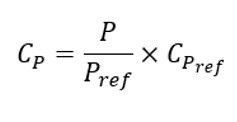
| Symbol | Definition | Unit |
| P ref | Reference pressure | Pa |
| C P | Specific heat at the pressure P | J/K/Kg |
| C Pref | Specific heat at the pressure P ref | J/K/Kg |