Masking
Results can be masked to obtain result values that are only within a user-defined area.
Masking Results
Arbitrary result files can be masked with a (0/1) result mask, a LOS mask or a clutter / morpho class mask. Click and select a mask option.
Mask Result File (0/1)
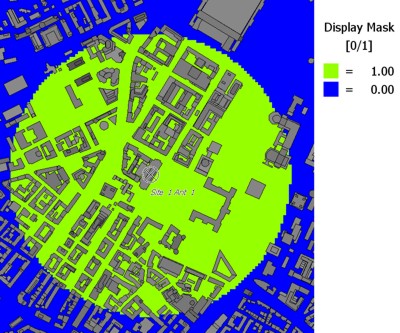
This option allows you to mask result data with user-generated masks, for example, a
circle around a transmitter. To define a mask, an arbitrary result file of the same
project has to be loaded. After that, all values of the result area which is to be
neglected (set to not computed
), are set to zero. All result values that remain,
are set to one by using the drawing tools. Afterwards the resulting mask file has to be
saved and renamed to have the extension .mas.
LOS Prediction Result
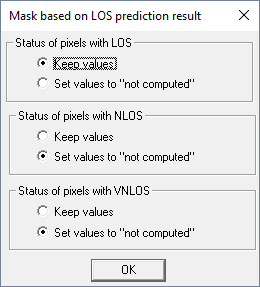
This option allows you to mask result data according to predicted line-of-sight
conditions. After selecting a predicted LOS result a dialog opens where the status of
the pixels for each LOS condition can be specified either to be set to Set values to
"not computed"
or Keep values.
Clutter / Morpho Data
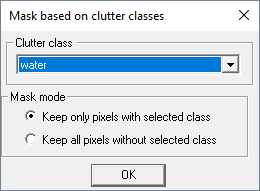
This option allows you to mask result data according to areas belonging to a specific clutter / morpho class. After selecting a clutter / morpho database a dialog opens where a clutter / morpho class can be selected for applying a mask mode.
Generate Mask from Result
This option allows you to create a mask file based on the currently loaded result file. A mask can be generated considering numerous parameters.
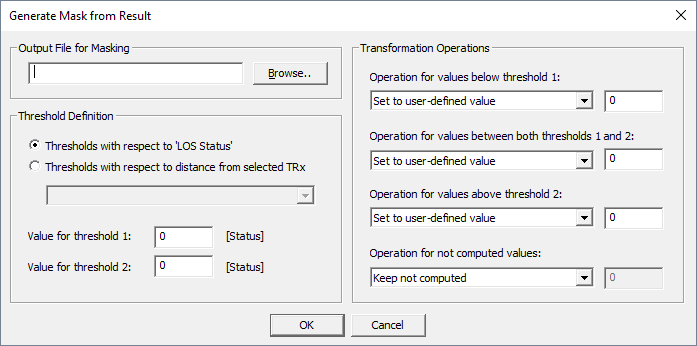
- Output File for Masking
- File name and path of the resulting mask file (.mas).
- Threshold Definition
- The threshold values can be applied to either the result values of the current matrix (including arbitrary planes) or to the distance from a receiver point to the selected transmitter.
- Transformation Operations
- Considering the two threshold values defined, all values contained in the result
file can be classified into three regions.
- The first region covers all values below threshold one.
- The second region contains all values between threshold one and two.
- The third region covers values above threshold two.
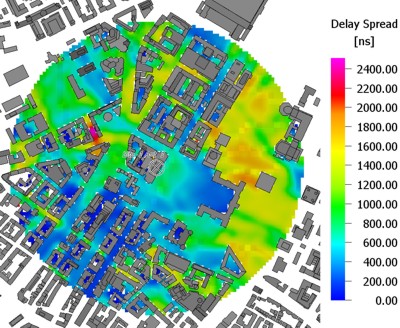
Example 1
Example 2
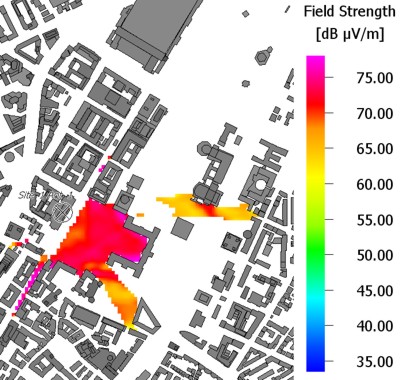
This example shows a field strength result which was masked with a LOS mask to keep only LOS pixels.
Example 3
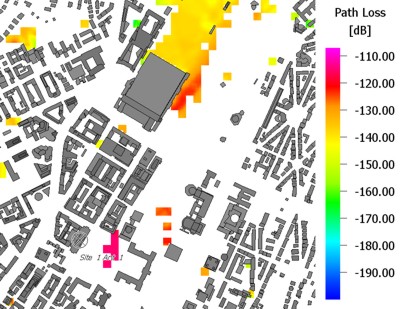
This example shows a path loss result which was masked with a clutter / morpho mask in
order to keep only those result pixels belonging to the clutter class open
.
Using the Generate Mask from Result option, various combinations of masks can be generated.
Example 4
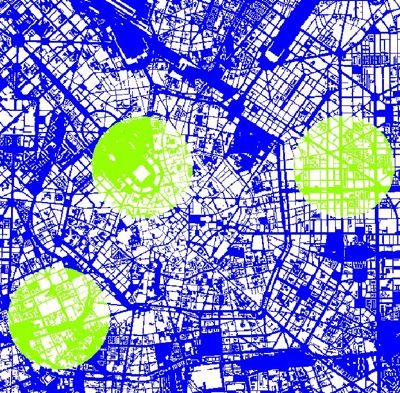
The following example shows three masks around three transmitter locations. These masks were combined to a single mask covering all three transmitter ranges.
Individual masks are combined using .
An existing mask can be loaded using and masked again.
Combining and loading masks make it possible to create complex masks for arbitrary purposes.
