The ProMan (Propagation) software package is designed to
predict path loss accurately between transmitter and receiver. The ProMan (network) software offers network planning modules.
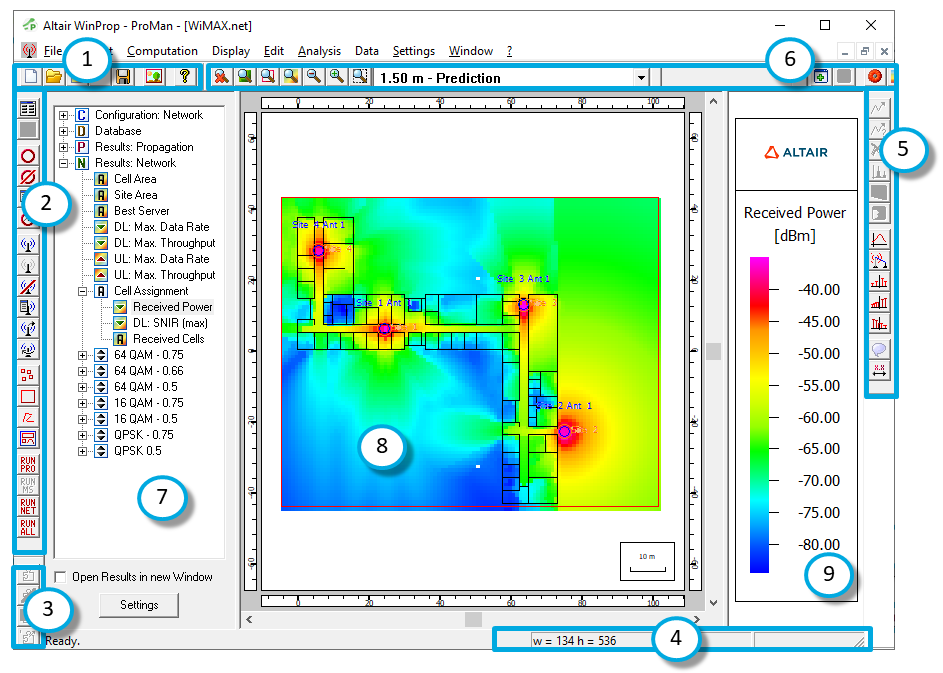
ProMan 's graphical user interface window consists of three
main parts, the Tree view on the left, the 2D View in the middle and the Legend on the
right side. The 3D View can be selected using the Display menu or by clicking on the
corresponding toolbar icon. The 3D view replaces the tree view and the 2D view window.
Besides this, ProMan offers four toolbars for quick access to
all frequently needed functionalities. The status bar on the bottom of the window gives
information about the current mouse position in the 2D view.
Figure 1 . ProMan user interface.
Standard
toolbar Project
toolbar Component
toolbar Status Bar Utility
toolbar Edit
toolbar Tree
view 2D view
Legend
Standard Toolbar
Table 1 . The standard toolbar and the icons it contains.
New project
Open project
Open result
Open recent file
Save
Export Bitmap
Show version information for ProMan
Project Toolbar
Table 2 . The project toolbar and the icons it contains.
Edit project parameter
Edit mobile station parameter
Set site
Erase site
Edit site
Move site
Set transmitter
Enable / disable transmitter
Erase transmitter
Edit transmitter
Move the transmitter. Depending on the selected propagation model, this
option may be not available).
Change transmitter's horizontal orientation
Define a general-purpose trajectory, for example for a moving
transmitting antenna or a moving prediction point.
Define prediction points. Depending on the selected propagation model,
this option may be not available.
Define prediction rectangle (horizontal)
Define prediction trajectories
Define a database area (polygon) to limit the number of objects that
will be considered in the simulation.
Compute propagation for all antennas
Compute mobile station prediction.
Run network simulation
Compute wave propagation, followed by mobile station prediction (if
enabled) and network prediction.
Component Toolbar
Table 3 . The component toolbar and the icons it contains.
Add component
Delete component
Edit component
Move component
Rotate antenna
Add cable
Add antenna
Add transceiver
Status Bar
The status bar shows the following information:
Coordinates, pixel (center) coordinates or column/line modeTip: By
default, the coordinates of the current mouse position is displayed.
Press Ctrl+F11 to enable/disable pixel (center) coordinates.
Press Ctrl+Shift+F11 to enable/disable column/line mode.
Data point at current mouse position (depends on the selected result in the tree
view). If a database is selected, the height is displayed.
Current time
Edit Toolbar
Table 4 . The edit toolbar and the icons it contains.
Reset zoom window
Repaint view
Zoom to prediction area (only in project mode available)
Zoom to result (only available if result loaded)
Zoom out
Zoom in
Zoom window
Select the prediction plane (horizontal and arbitrary)
Save current view area (2D-view)
Remove selected view area (2D-view)
Presentation plot
Threshold color mode
Edit data
Change edit-value
Additional data layers
3D view
Settings
Information
Utility Toolbar
Table 5 . The utility toolbar and the icons it contains.
Display of ray paths
Single display of rays
Delete all rays
Impulse response
Show prediction planes in a separate dialog
Show / hide info dialog
Line plot
Line plot (from transmitter)
Probability density function (relative, total area)
Cumulative density function
100% - Cumulative density function (total area)
Show tooltip
Show distance
Tree View
Table 6 . The tree and the main icons it contains.
Network configuration.
Databases used in the project.
Propagation results.
Network results.
Human exposure to electromagnetic fields (EMF) results.
Electromagnetic compatibility (EMC) results.