ADD/CMD/CTRL Line Analysis
Use ADD/CMD/CTRL Line Analysis to analyze interconnect network of command and control group nets of DDR BUS in time domain to obtain the eye diagrams and transient waveforms which are different views of the signal delay and distortion.
When performing an Automatic DDR Bus Simulation, please consider the following :
- Net Topology Review: Please review of the net topology for Data, Address, Command, and Control nets in advance.
- Power Setting: Please set power as 0V.
- Floating Nets: Please verify that there are no floating nets.
The analysis automatically measures setup/hold timing margin and creates a timing margin report.
Creating a network analysis model starts with selecting clock net and CMD/CTRL net from the net listing. The net name is initially assigned to the model name. In case of CMD/CTRL group of DDR BUS, CPU component can only be selected for CMD/CTRL analysis using Active Driver Pin button.
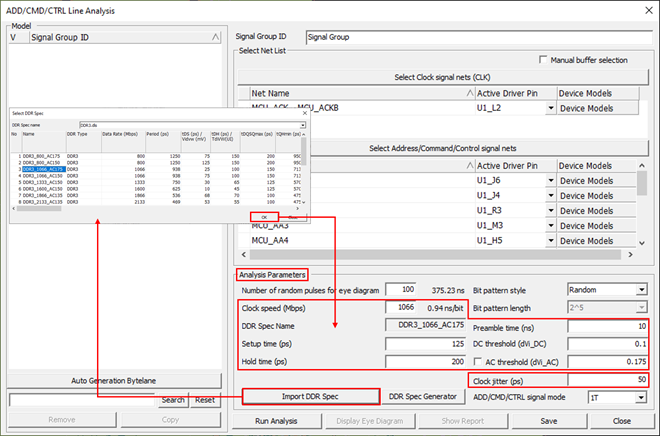

The analysis is performed upon selecting Run Analysis menu.
Eye Diagram analysis is running transient circuit simulation on the network model to obtain eye diagrams at the input nodes. An eye diagram or eye pattern is obtained from overlapping multiple waveforms at the receiver node of a net generated by randomly selected high/low states of the input signals for the selected net and adjacent nets. The coupling effects from the adjacent nets are reflected in the waveforms. Prior to running analysis, users can change the analysis control parameters such as the number of random pulses and bit pattern style.

